The FusionReactor agent has access to a variety of metrics from inside the JVM. The Metrics Explorer feature allows these metrics to be viewed and graphed quickly and easily.
The Metrics Explorer interface is split into two sections, the query builder and the graph viewer.
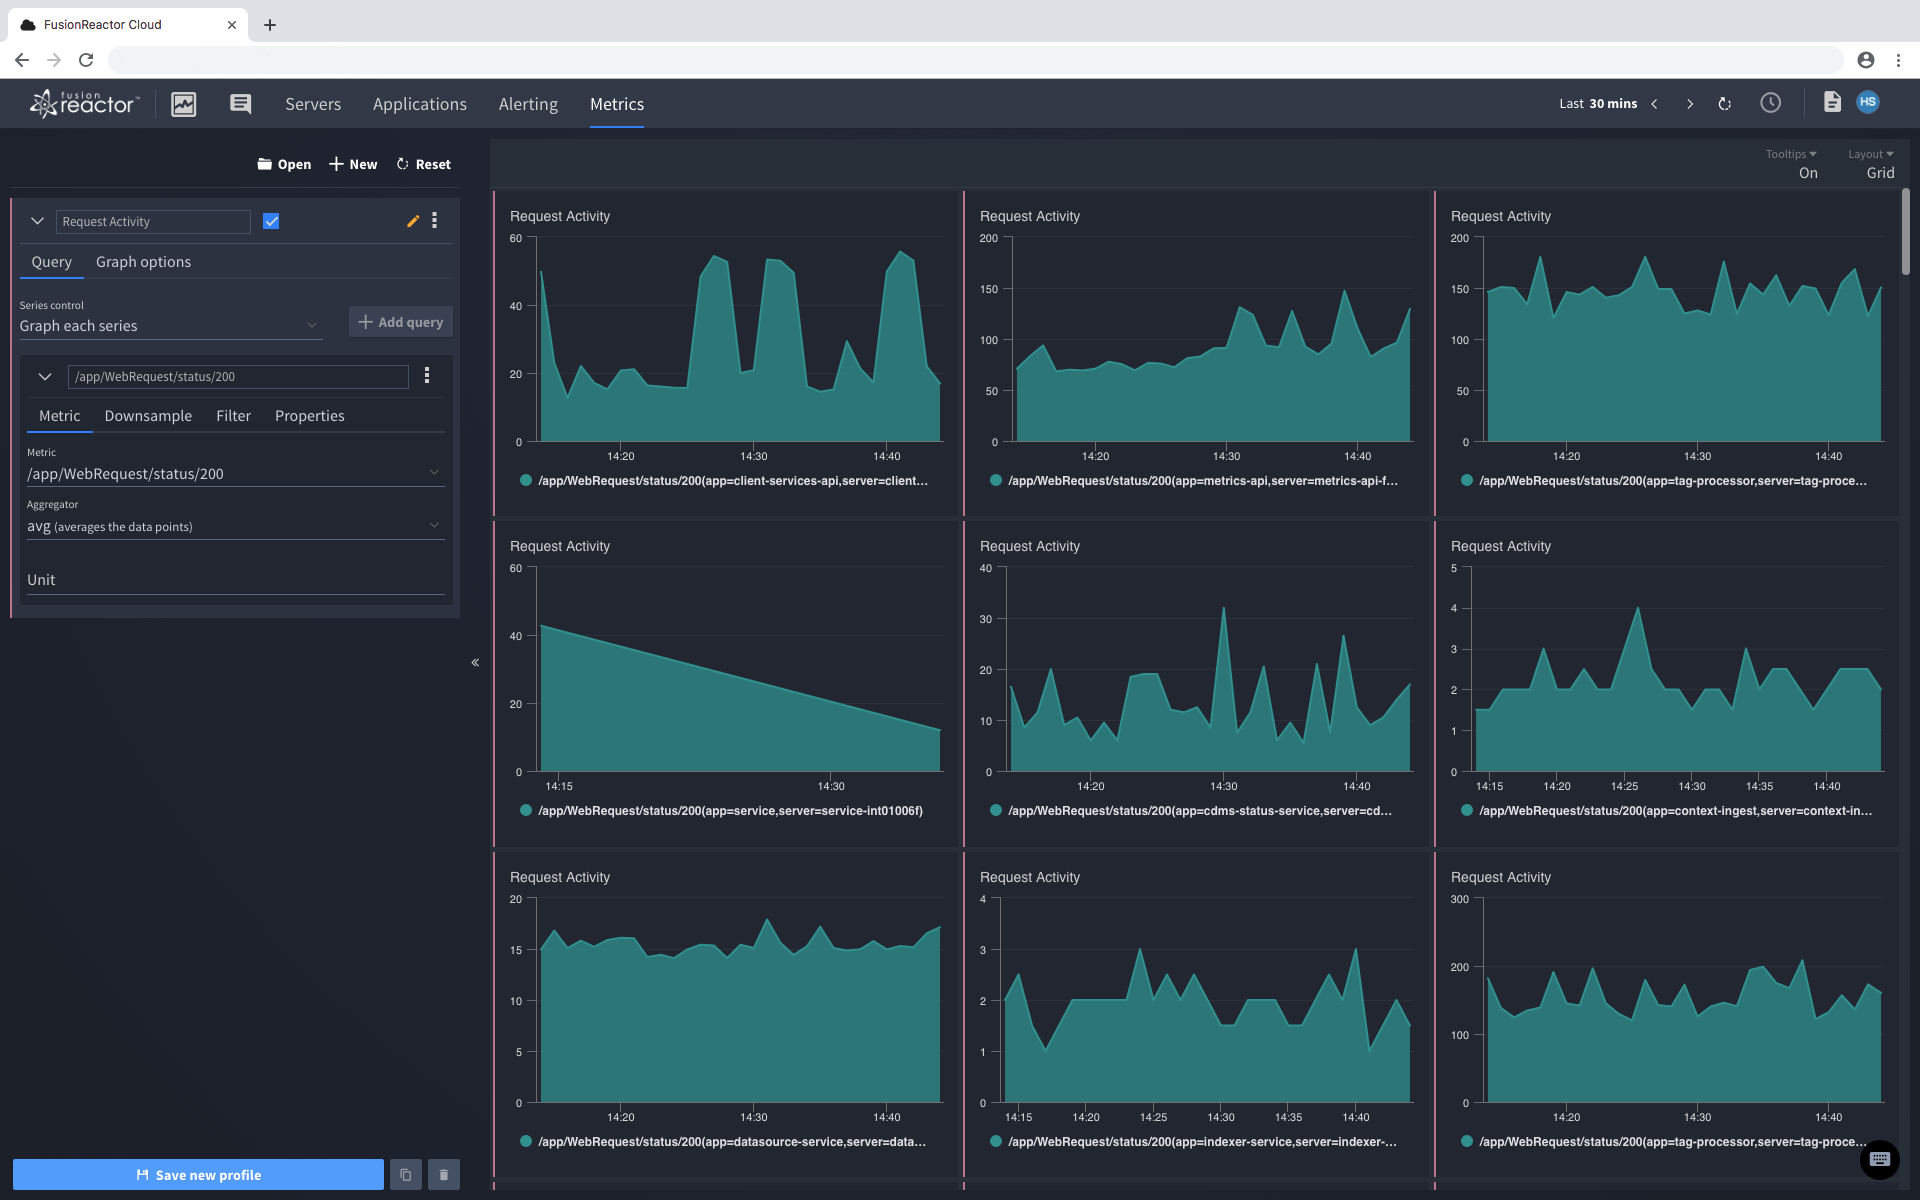
Query builder

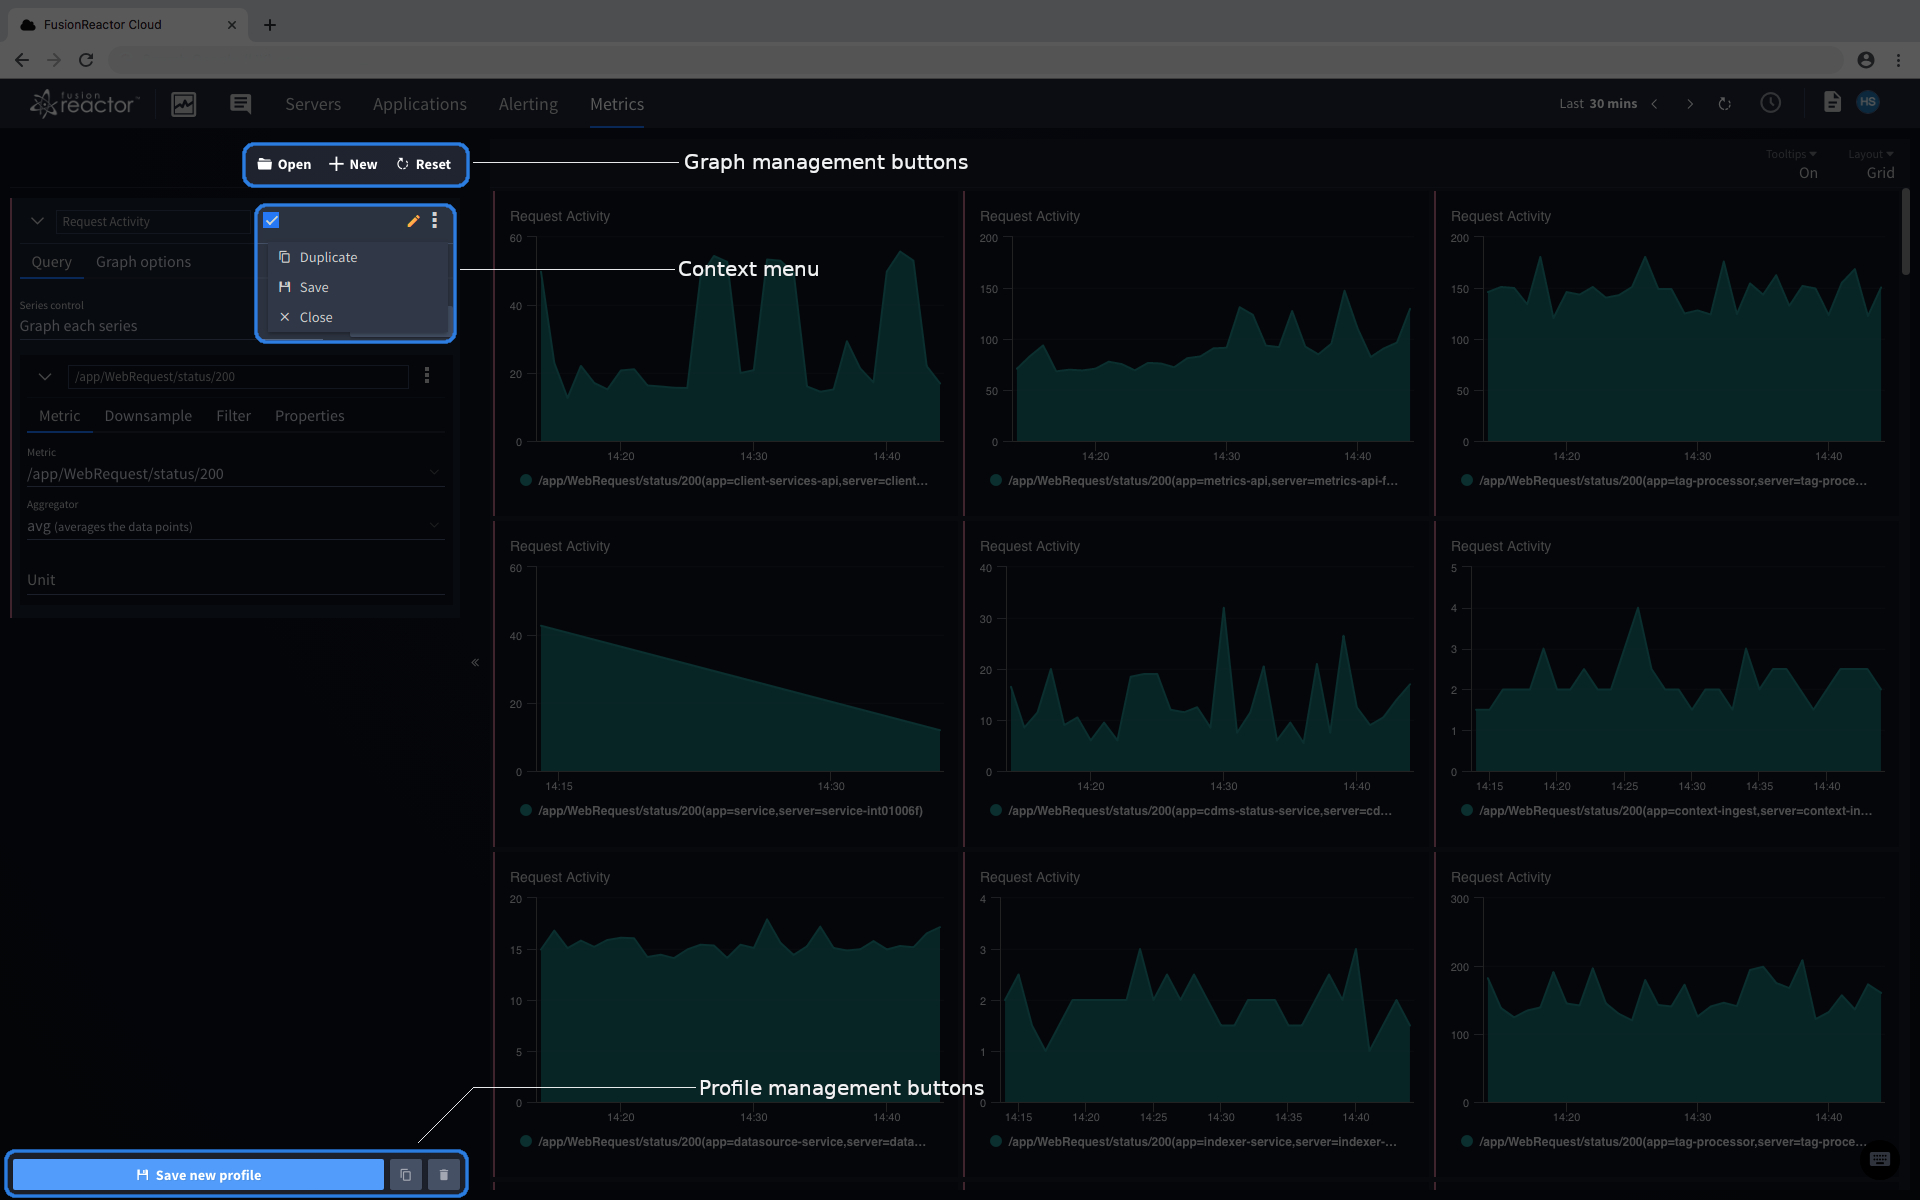
The query builder (as shown above) contains all of the controls required to create queries, graphs and profiles. From here you can also manage saved graphs and profiles for use in other areas of the product.
The query builder can be used to create graphs, and those graphs can be saved into a profile. It allows for complete control over the graphs that are created as a direct result of each query. Each graph can have either a single, or multiple series.
Clicking the reset button will return the query builder back to its original state.
Graph configuration
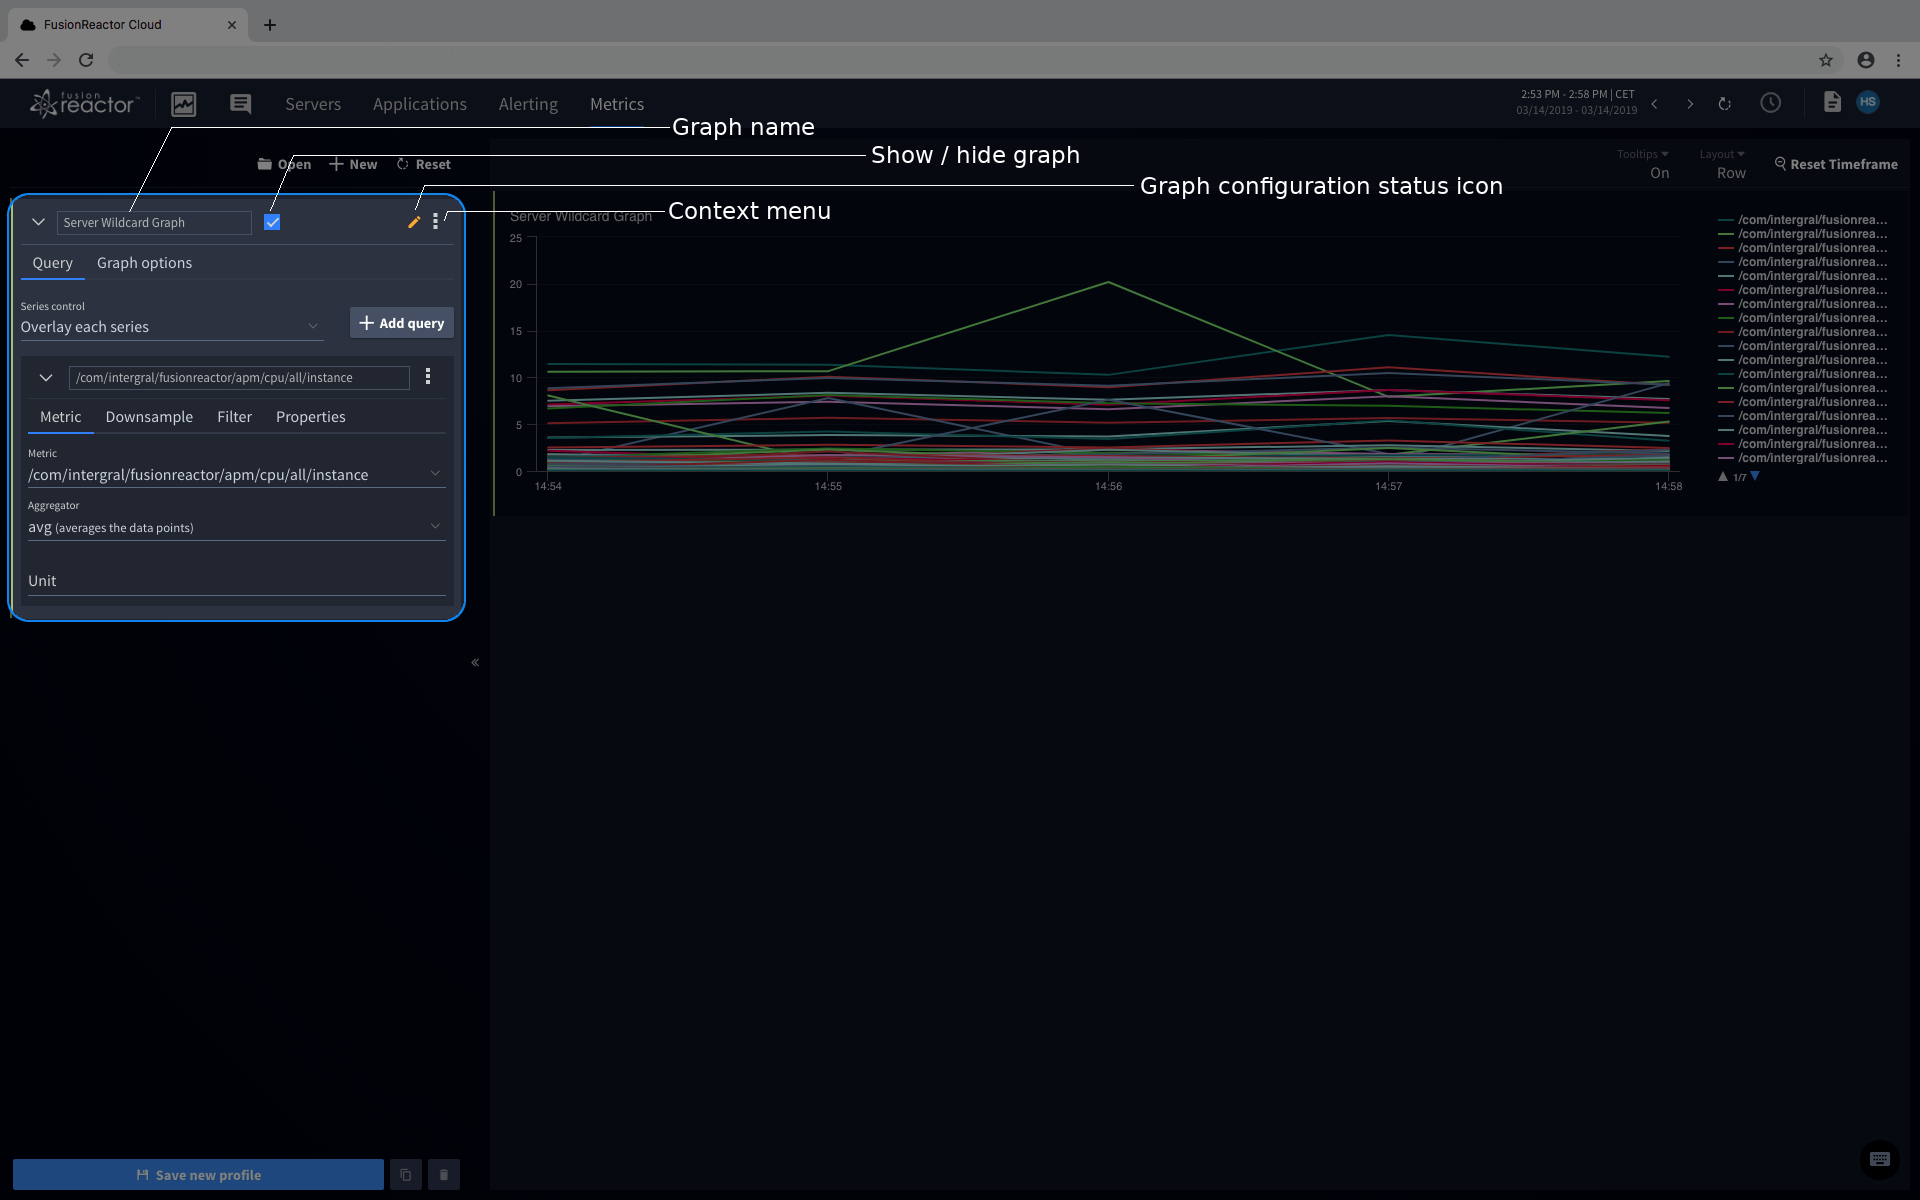
The graph configuration section of the query builder defines each graph that the Metrics Explorer displays.
It can be used to create a single graph containing multiple series or create a new graph for each series of data configured in the series configuration.
The toggle for showing and hiding a graph will set if it is currently visible in the Graph viewer.
The graph configuration status icon (see image above) shows the state of the configuration. There are currently three icons that mean the following:
 Configuration is invalid.
 Current configuration is unsaved.
 Current configuration is/has saved.
The context menu (see image above) allows the following actions to be performed on the graph:
- Duplicate: copy the graph configuration into a new one
- Save: save the graph configuration
- Close: close the graph and graph configuration
Graph configuration is split between the query and graph configuration tabs.
Query tab
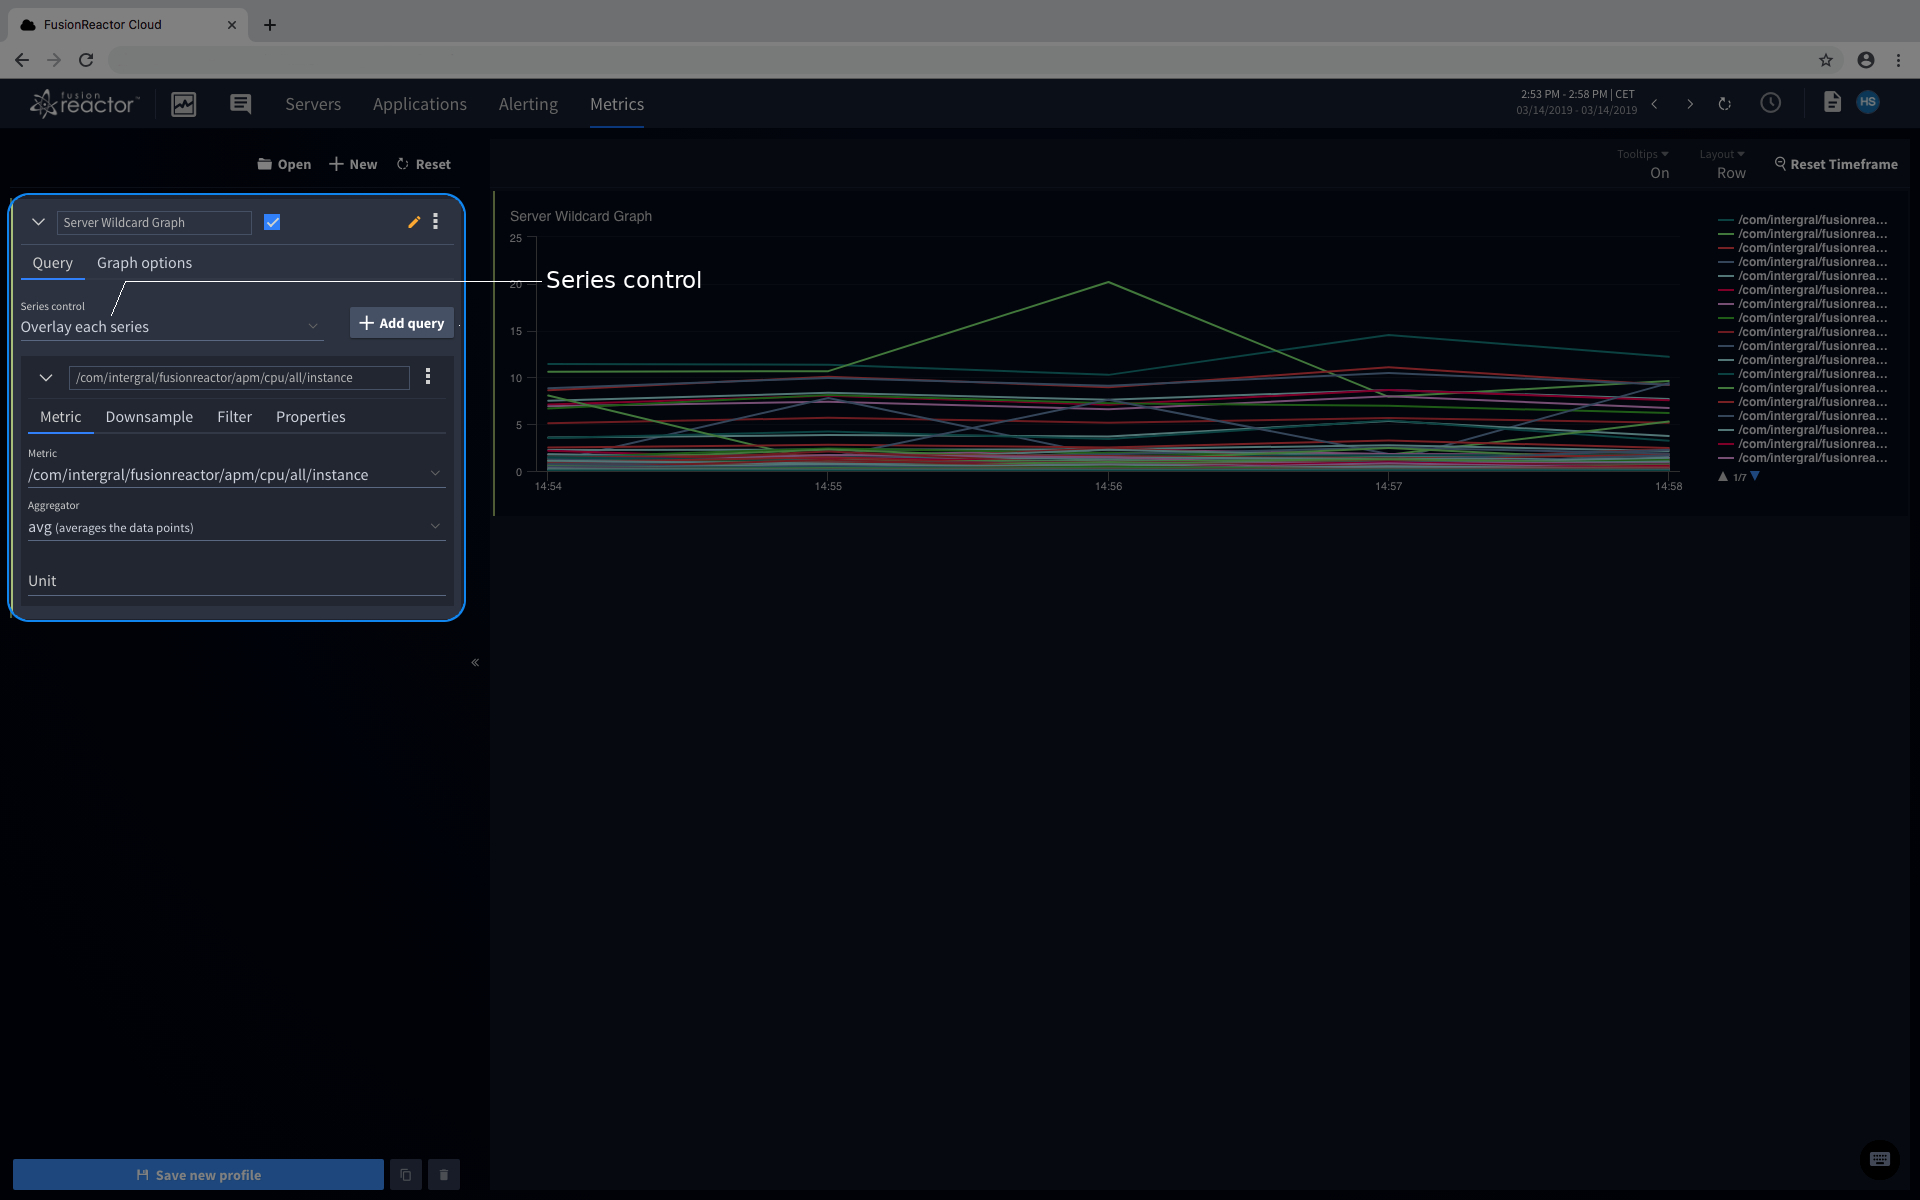
The series control provides several options for how the series will be displayed:
- Overlay each series: plot the data based on its value
- Graph each series: plot each series on a separate graph (unavailable for graphs with multiple queries)
- Stack all series: stack each series on top of each other
Multiple series can be created by pressing the 'Add query' button which can be configured in the series configuration.
Graph options tab
The graph options tab contains the specific configuration options for each graph. The generic and y-axis tabs contain the configurable options.
Generic
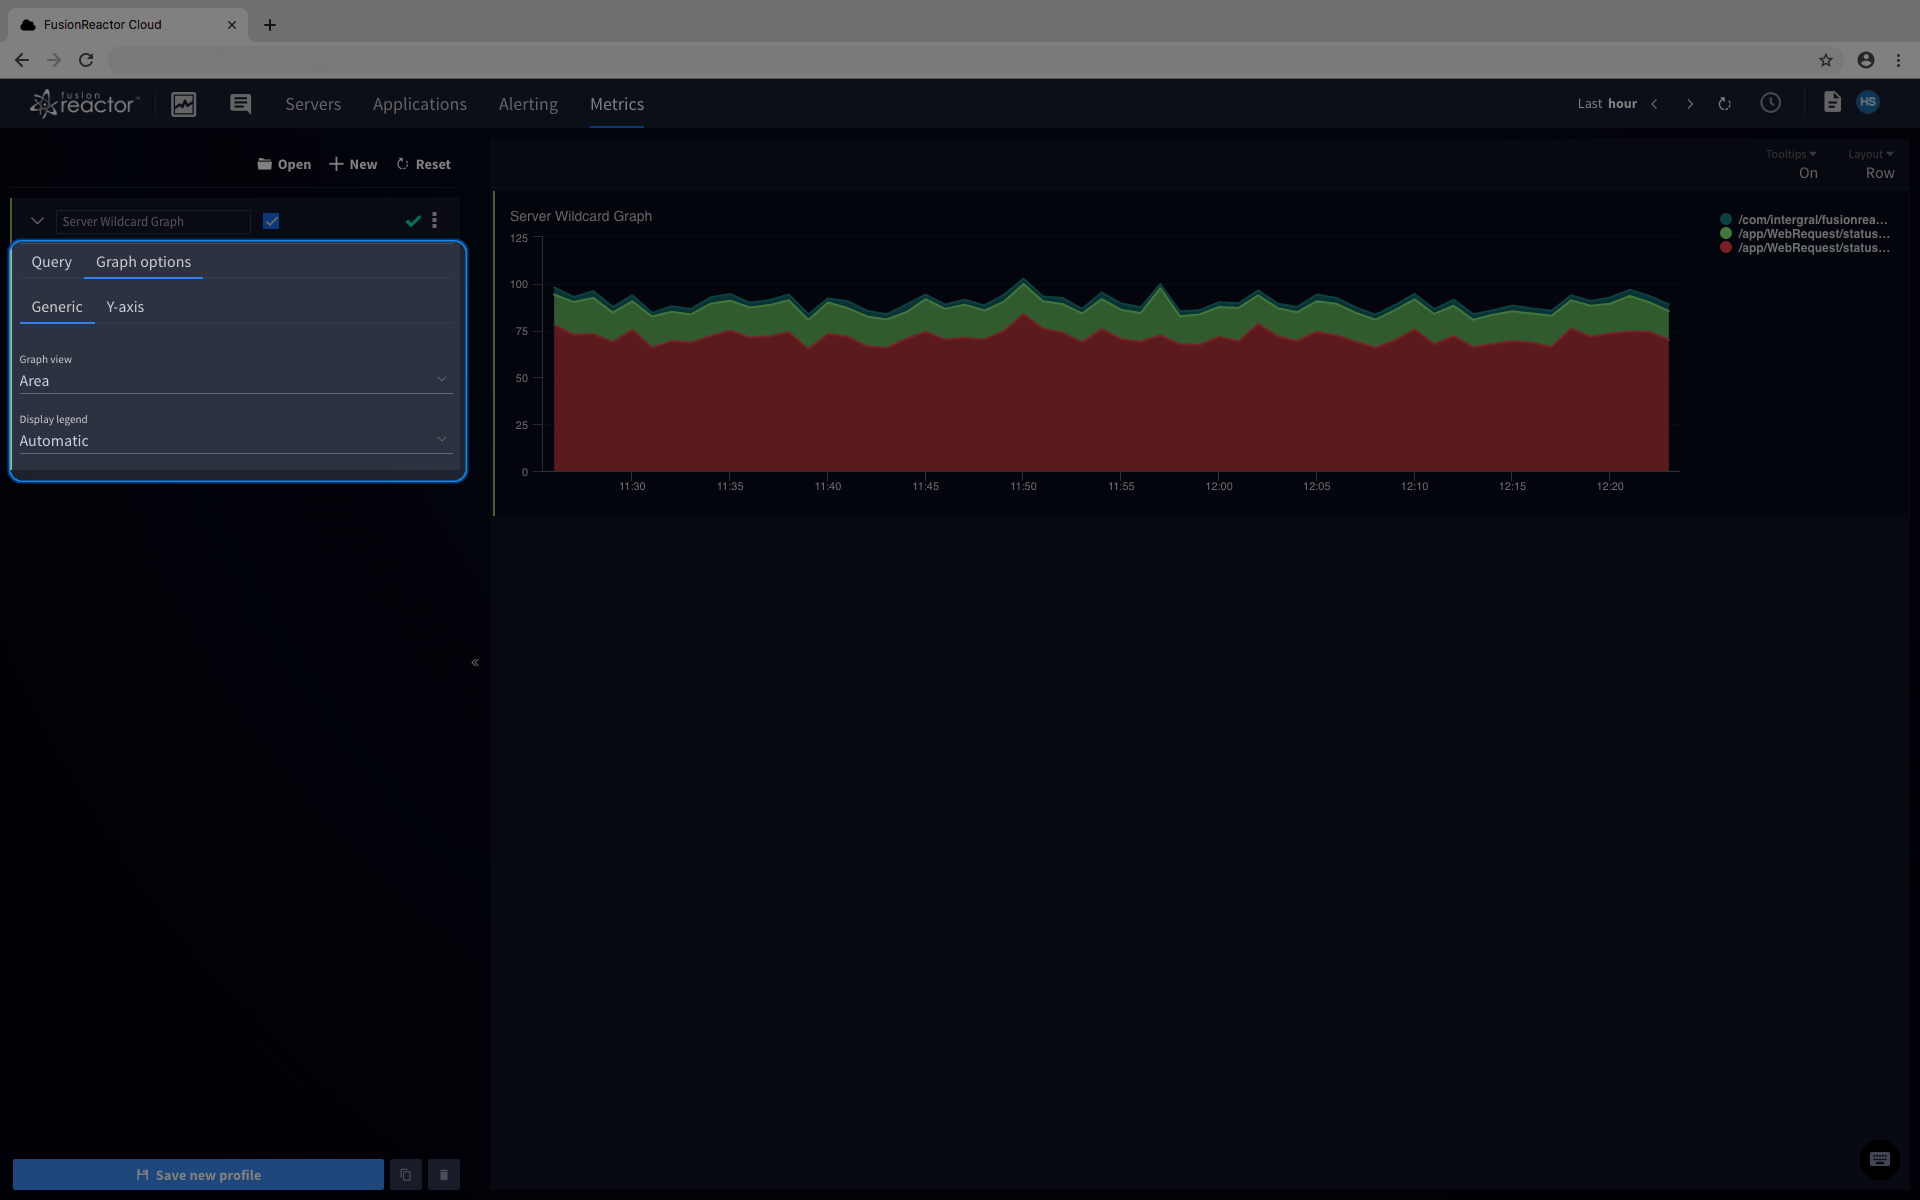
In the generic options, graph view and legend display can be configured.
The graph view configuration determines whether the series are plotted as lines or filled in areas.
The display legend option allows the box containing a symbol and name for each series found next to the graph to be shown or hidden. An automatic option is available which defaults to displaying the legend on the Metrics Explorer and hiding it on the server graphs page.
Y-axis
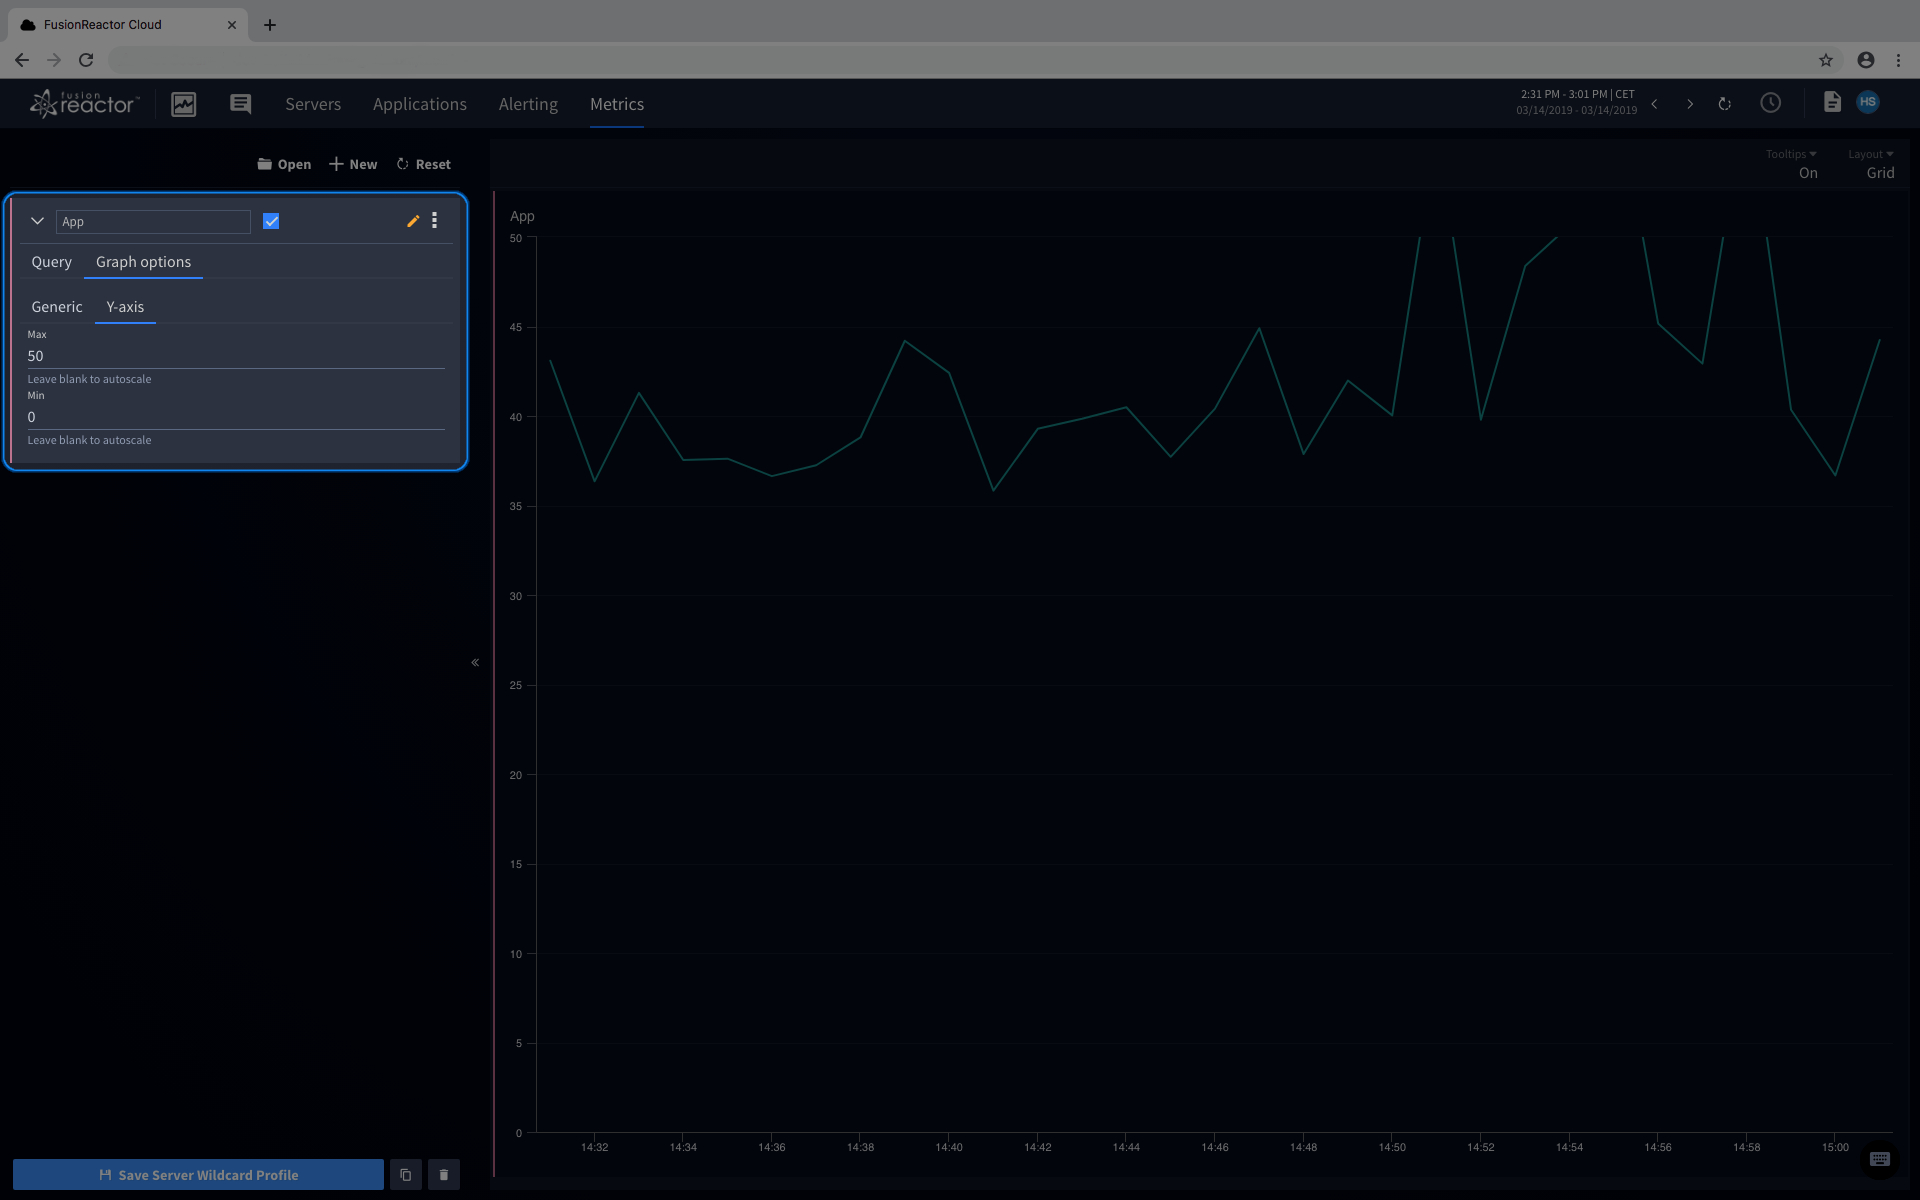
The maximum and minimum y-axis values are configurable on the y-axis tab.
Setting the max value determines the greatest point the graph's series will be plotted to. Leaving the value blank will cause the graph's maximum to be automatically chosen based on the values of the plotted data.
Setting the min value determines the lowest point the series will be plotted to. Both leaving the value blank and the default value of 0 causes the minimum value to be automatically chosen.
Both the max and min configurations can be set to positive or negative numbers.
NOTE: The Y-Axis may sometimes show a values different to what you have set. This is merely the graph trying to label the Y-axis with the most sensible increments, and your min/max settings will still be applied to the data plotted.
Series configuration
The series configuration is where the bulk of the graph configuration is made. It controls the metric series that are displayed, the resolution of the data, how the data is grouped and the color of the series.
Metric Tab
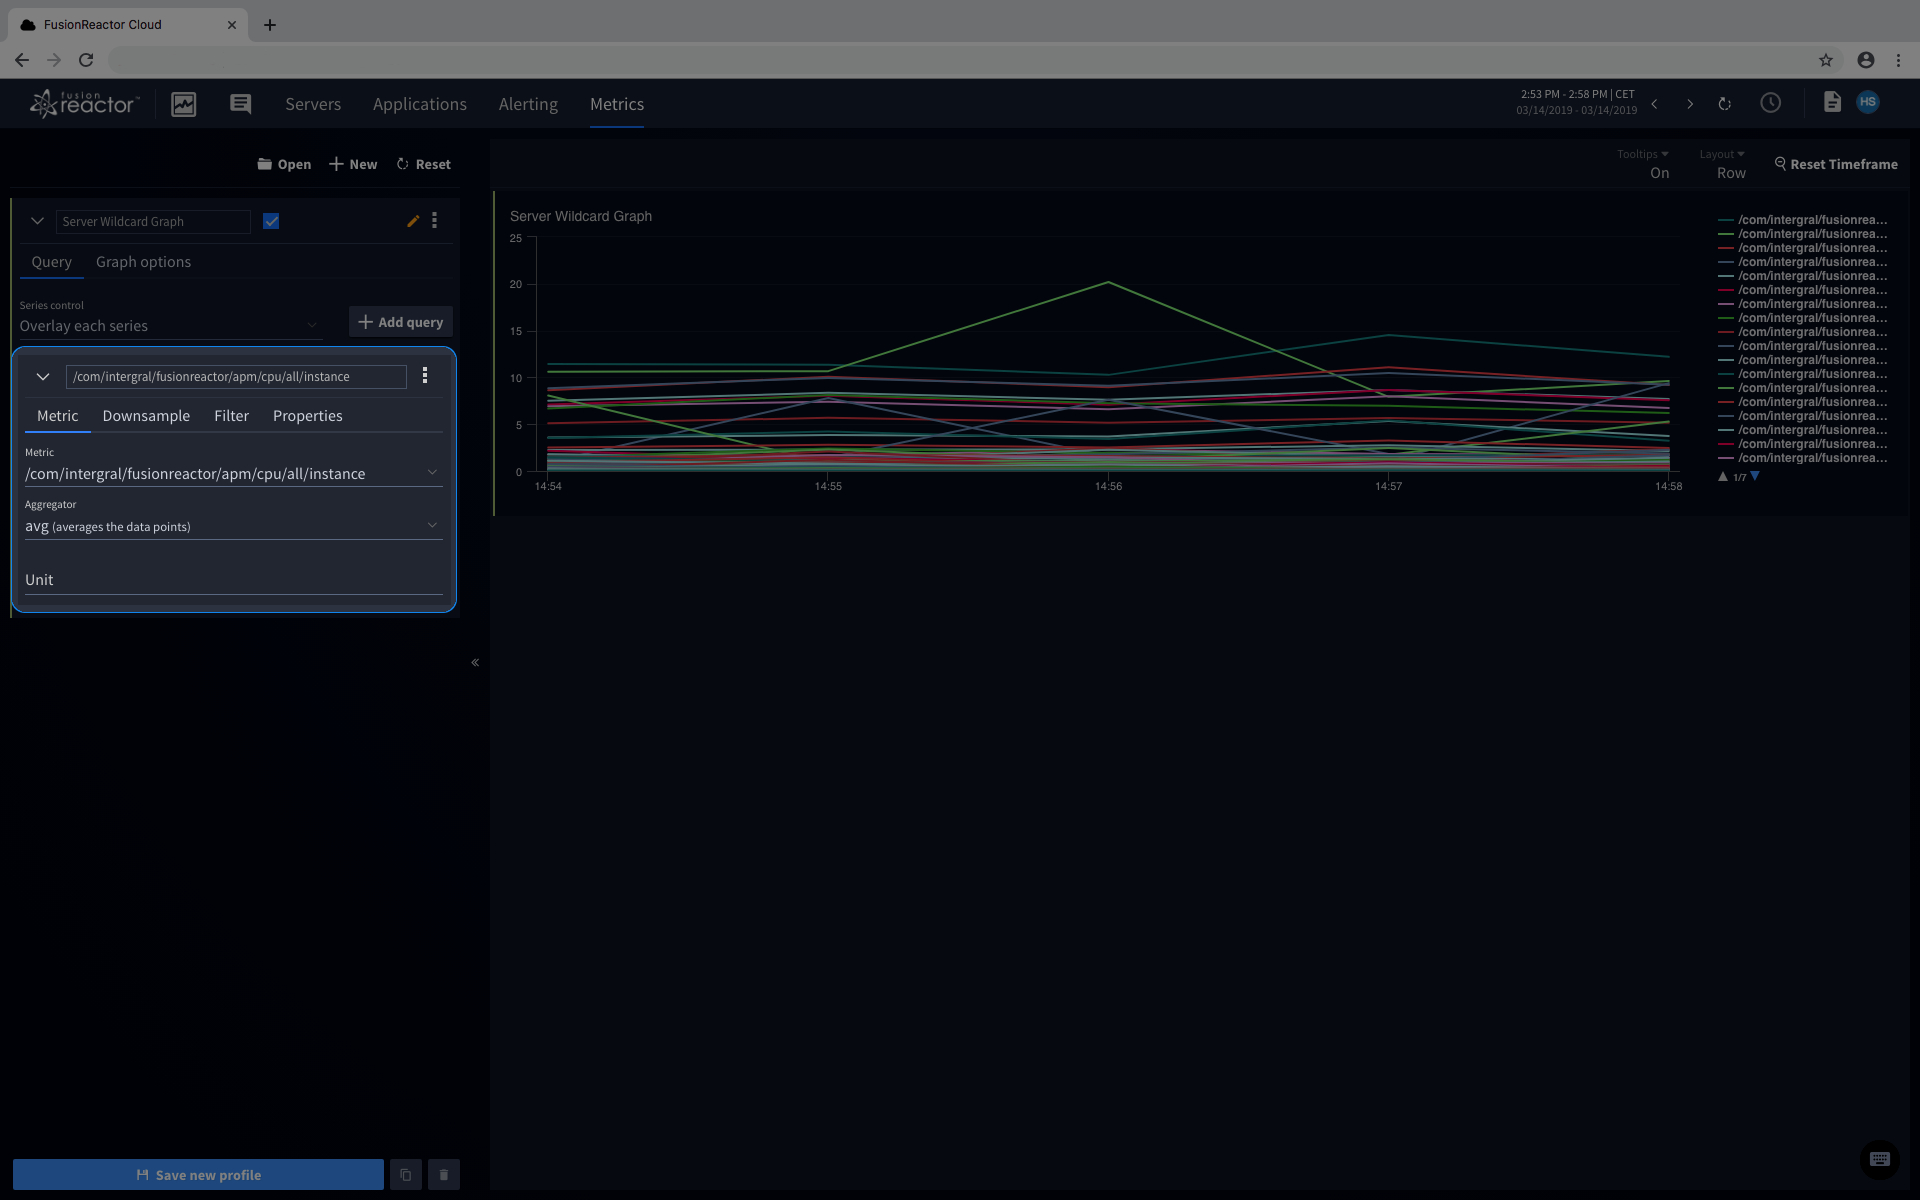
Metric
The metric is the series of data you would like to query for, including its namespace which gives hints to how that data can be grouped later on. Typically, generic application metrics are namespaced with /app/.
Aggregator
The aggregator allows you to choose how the selected metric should be utilized. All metrics available inside the Metric Explorer are aggregates. This means that typically you have access to SUM, COUNT and AVG for each metric.
Unit
The value entered here will be appended onto the data shown in tooltips, allowing you to define your own units for each query.
Downsample Tab
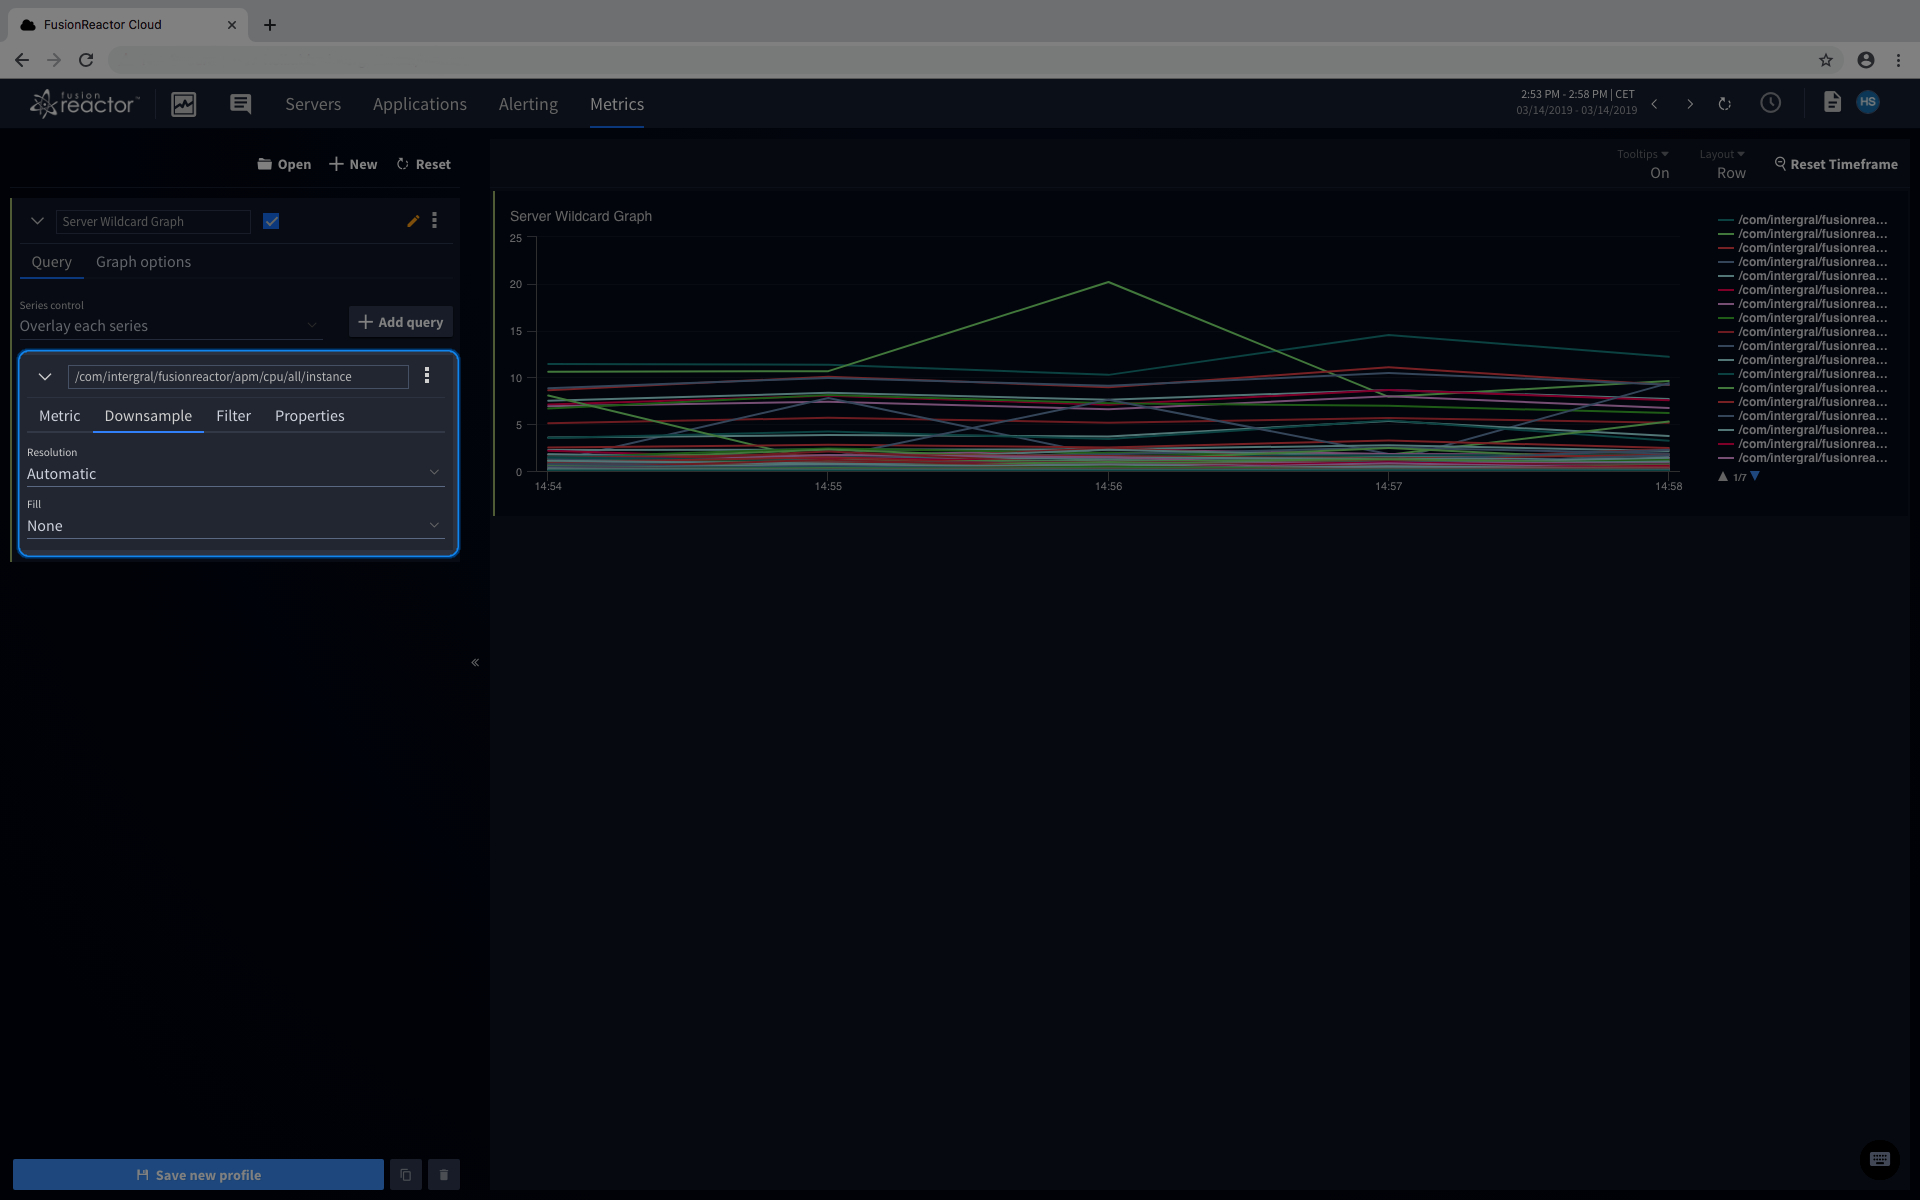
Resolution
The downsample control specifies the resolution of the data. Automatic returns a resolution that is suitable for the time frame that is currently selected. Automatic will select a time frame based on these criteria:
- 1 Minute - time frame < 6 hours
- 1 Hour - time frame > 6 hours
- 1 Day - time frame > 1 week
Fill
The fill control specifies how gaps in the data should be treated. The following options are available:
- Null
- Nothing is inserted where data points are missing.
- Line graphs will leave the gaps empty.
- Area graphs will act as if there is a 0 on the next data point.
- Zero
- Inserts zeros into the graph wherever data points are missing.
- None
- Nothing is inserted where data points are missing.
- Gaps in the data are bridged together between existing data points.
Filter Tab
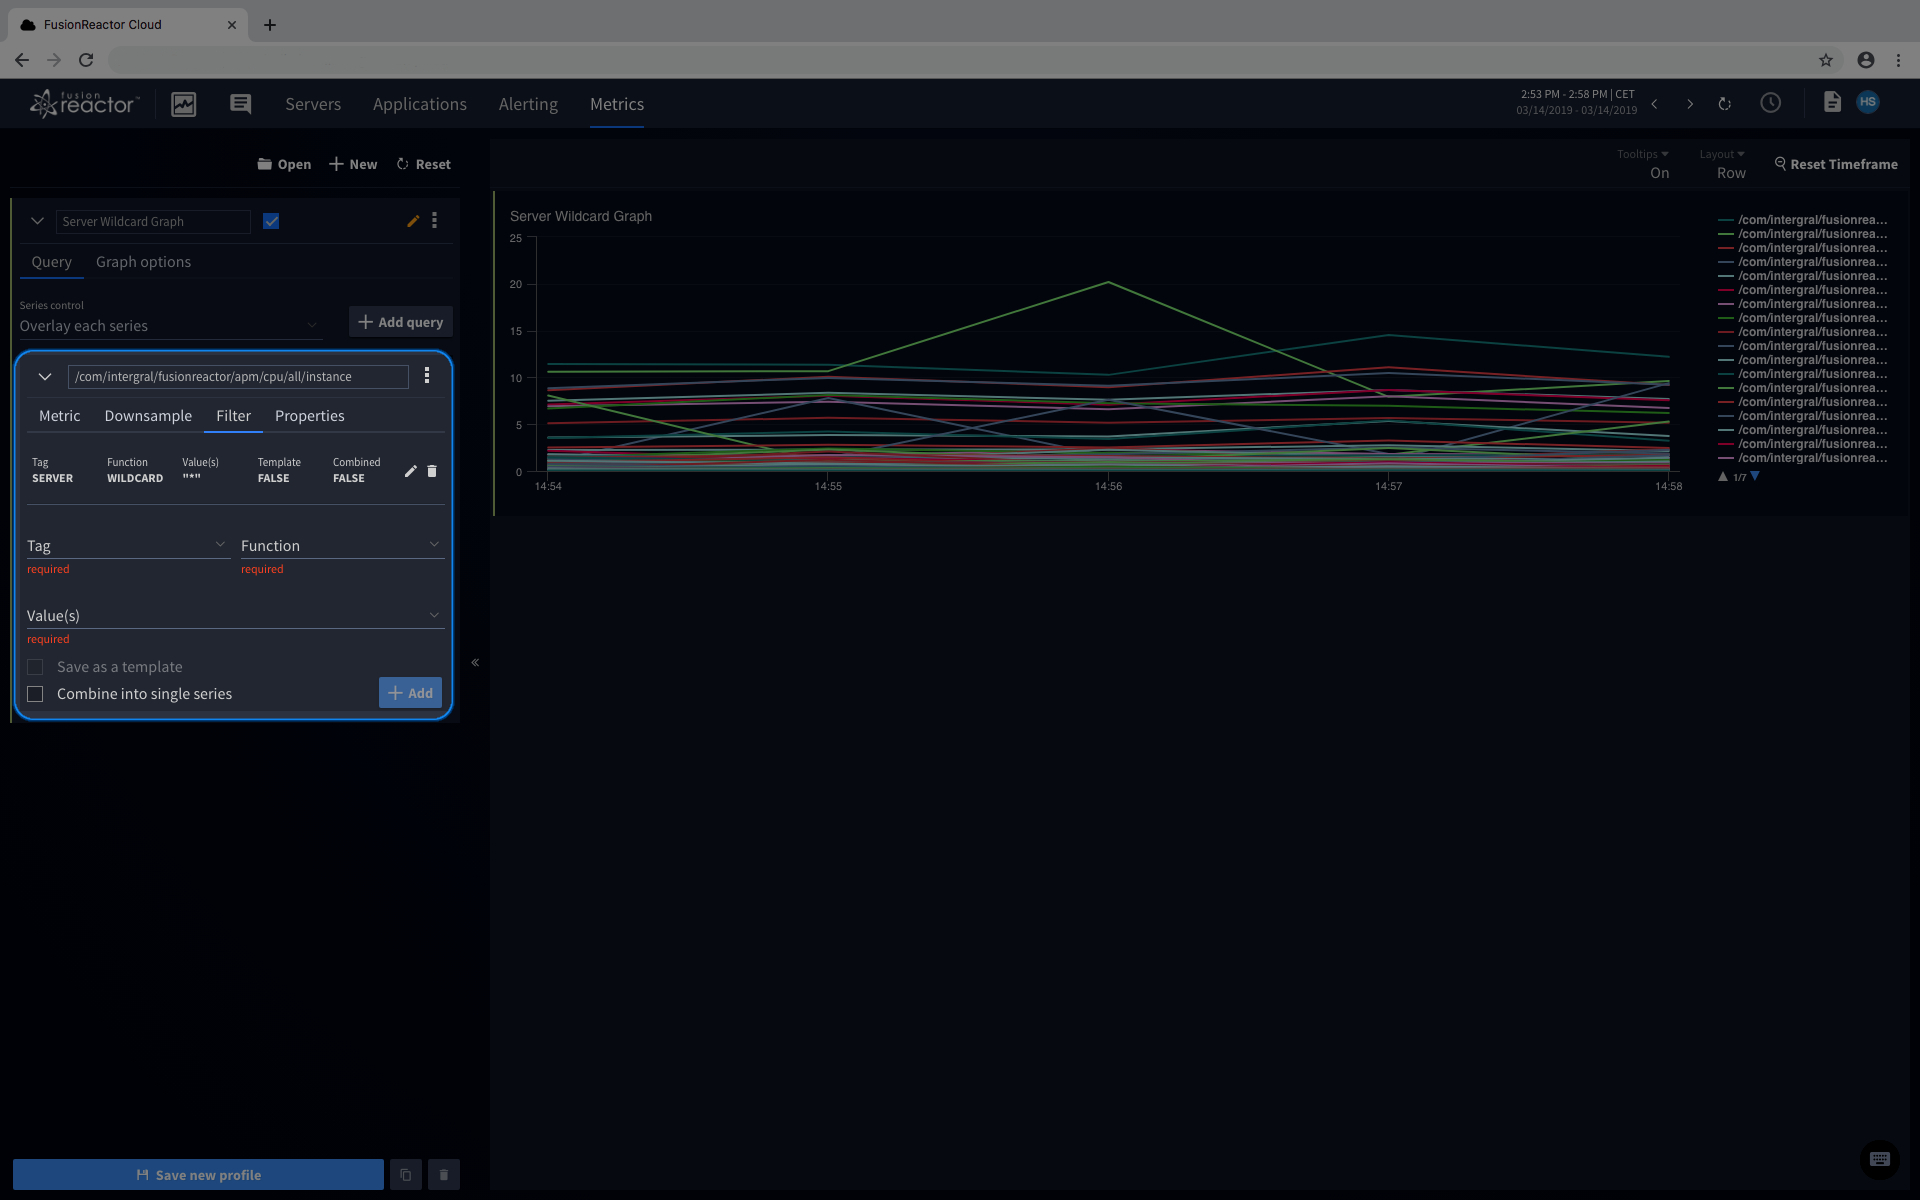
The filter tab controls how the data is grouped before the graphs are created. With no filter added the default behavior is to aggregate all of the available data together into a single series.
Creating filters allows you to split or group the data in various ways.
Tag
The entity type you wish to split the data on; typically this is either an application or FusionReactor instance.
Function
This control allows you to select how the returned data is grouped. If no filter is configured then the graph will behave as if wildcard(*) is the filter combined into a single series. The available options are shown below:
-
iwildcard - performs pre, post and in-fix glob matching of values. The globs are case insensitive and multiple wildcards can be used. The wildcard character is the * (asterisk).
Case insensitivity is achieved by dropping all values to lower case. At least one wildcard must be present in the filter value. A wildcard by itself can be used as well to match on any value for the tag key.
-
literal_or Accepts one or more exact values and matches if the series contains any of them. Multiple values can be included and must be separated by the | (pipe) character.
-
not_key - skips any time series with the given tag key, regardless of the value. This can be useful for situations where a metric has inconsistent tag sets.
NOTE: This function does not take a value.
-
not_literal_or Accepts one or more exact values and matches if the series does NOT contain any of them. Multiple values can be included and must be separated by the | (pipe) character.
-
regexp - provides full, POSIX compliant regular expression. If the pattern is not a valid regular expression then an exception will be raised.
-
wildcard Performs pre, post and in-fix glob matching of values. The globs are case sensitive and multiple wildcards can be used. The wildcard character is the * (asterisk). At least one wildcard must be present in the filter value. A wildcard by itself can be used as well to match on any value for the tag key.
Value
This is where you put filter value(s) that will be passed into the function defined above. Variants of literal_or will give you a selection of filter values to choose from, whilst regexp and variants of wildcard let you write your own filter. Lastly not_key does not take a value.
Save as a template
This checkbox allows you to create a template graph. This button is disabled by default unless you choose to give the graph a literal_or filter.
Template graphs will automatically swap the filter value when using the Server graphs viewer. In order to see your custom graph on the server graphs viewer pages, you must make sure the graph has at least one filter saved as a template.
Combine into single series
This checkbox allows you to select whether or not the results of the query should be grouped together into a single series. If left unchecked, a series will be drawn for each unique instance or application.
Properties Tab
Color
This property lets you choose the color used to draw the series on the graph. If not configured, a color is automatically assigned.
Managing Graphs and Profiles
Graphs made in the Metrics Explorer can be saved for later, as can profiles that are made up of graphs. This section will walk-through how to save and manage them.
Managing Graphs
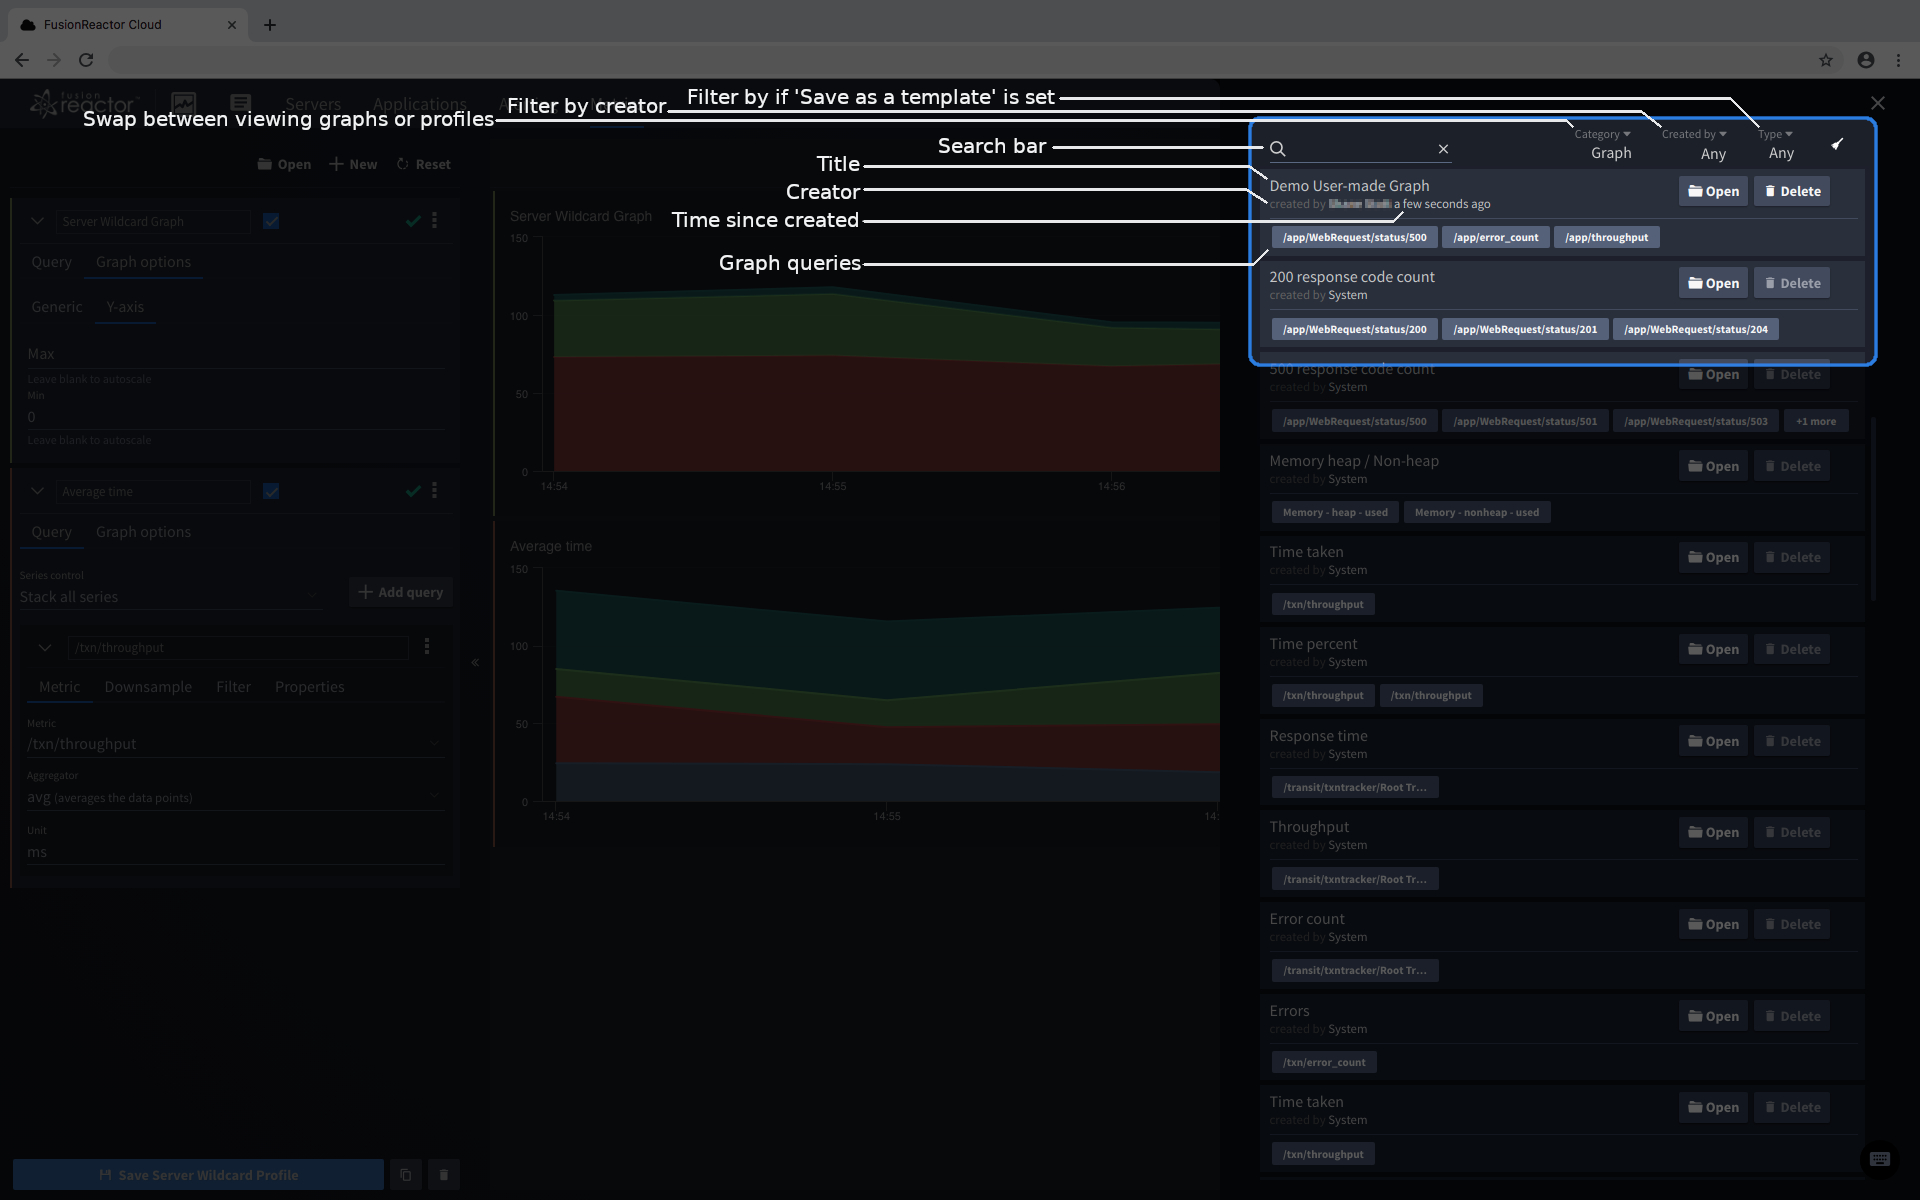
Click open on the graph management buttons to view the existing graphs (and profiles). Doing so will open a drawer (as shown below) with all existing graph configurations.
These graphs can be filtered using the labeled features to help you search through them.
The search box will sort through both graph names and query names, so inputting /app/WebRequest/status/200 would show all graphs with that query.
From this interface you can open a graph to edit in the query builder or delete them from your account.
Saving New Graphs
First you will need a new graph configuration in the query builder. Clicking New will put a blank graph configuration in the query builder. If the graph's configuration is valid, but not saved, then the context menu should allow you to save the graph. See Graph configuration for more information on the context menu and graph state icons.
Editing Graphs
Start by finding the graph configuration you wish to edit by clicking Open at the top of the query builder.
Click open on the row with the graph you wish to edit, and it will be loaded into the Query Builder. Now that it is in the query builder, you can make the edits you wish. When saving those changes, the graph you had loaded will be updated to match the new configuration.
Alternatively you can duplicate the loaded graph by using the duplicate button also found in the context menu. Saving the duplicate will add a new graph to your saved configurations rather than overwriting the original.
NOTE: Graphs that are 'created by System' are part of FusionReactor Cloud. You can edit these graphs in the query builder; edited 'System' graphs are always saved as new graphs.
Deleting Graphs
You can view an existing graphs by clicking Open. Click delete on the row with the graph you wish to remove. A pop-up will appear for you to confirm this action, click Ok to proceed and the graph will be removed.
You can only delete user-made graphs. Deletion is disabled for 'System' graphs.
NOTE: Graphs cannot be recovered once deleted.
Managing Profiles
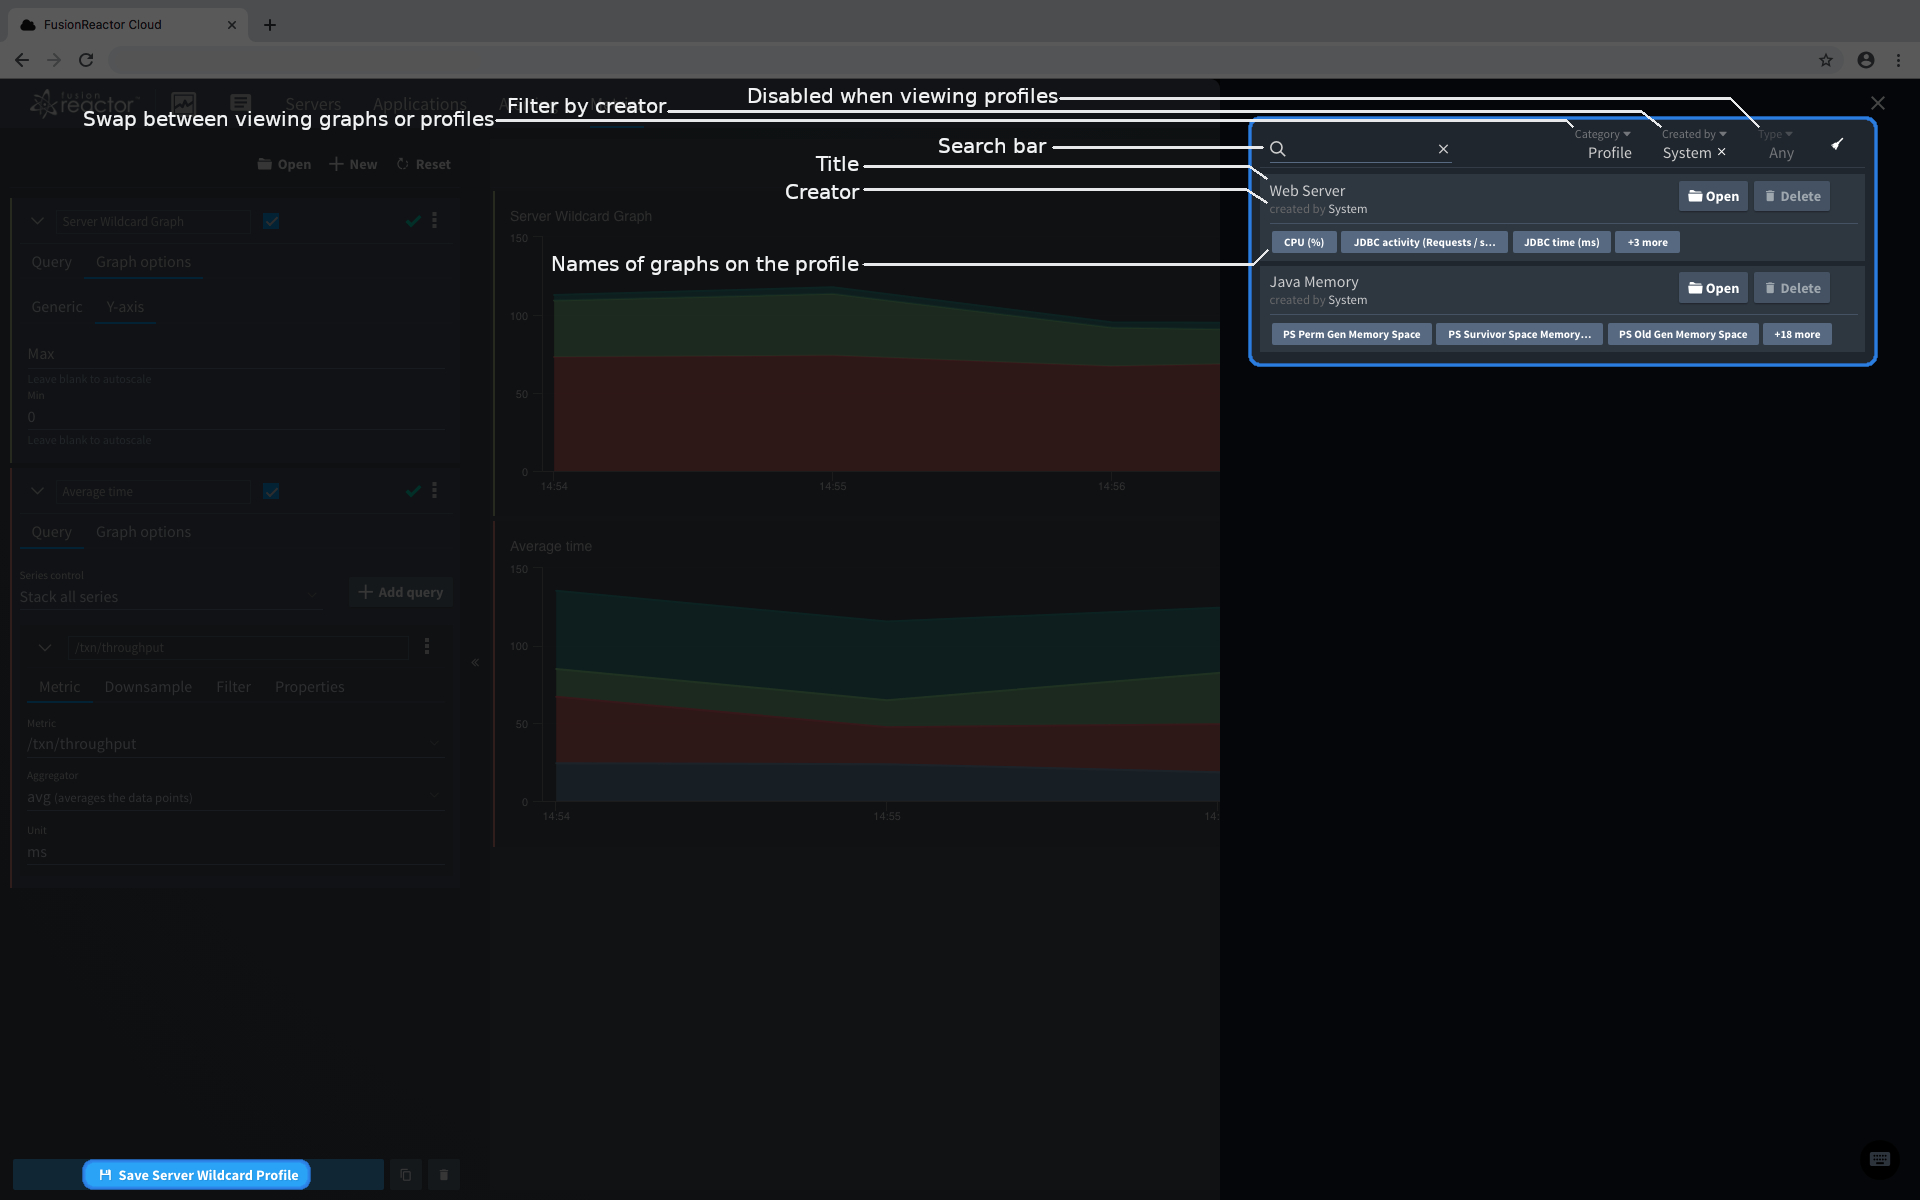 Click Open on the graph management buttons to view the existing profiles. Graphs will be visible at first, you must use the category dropdown to view profiles.
Creating Profiles
Once you have configured or loaded at least one valid graph into the query builder, the 'Save new profile' button will be enabled at the bottom of the page (see image under Managing graphs and profiles).
NOTE: After saving the profile, the Save new profile button will now show the name of the profile. This means it has been loaded to edit instead of creating a new one.
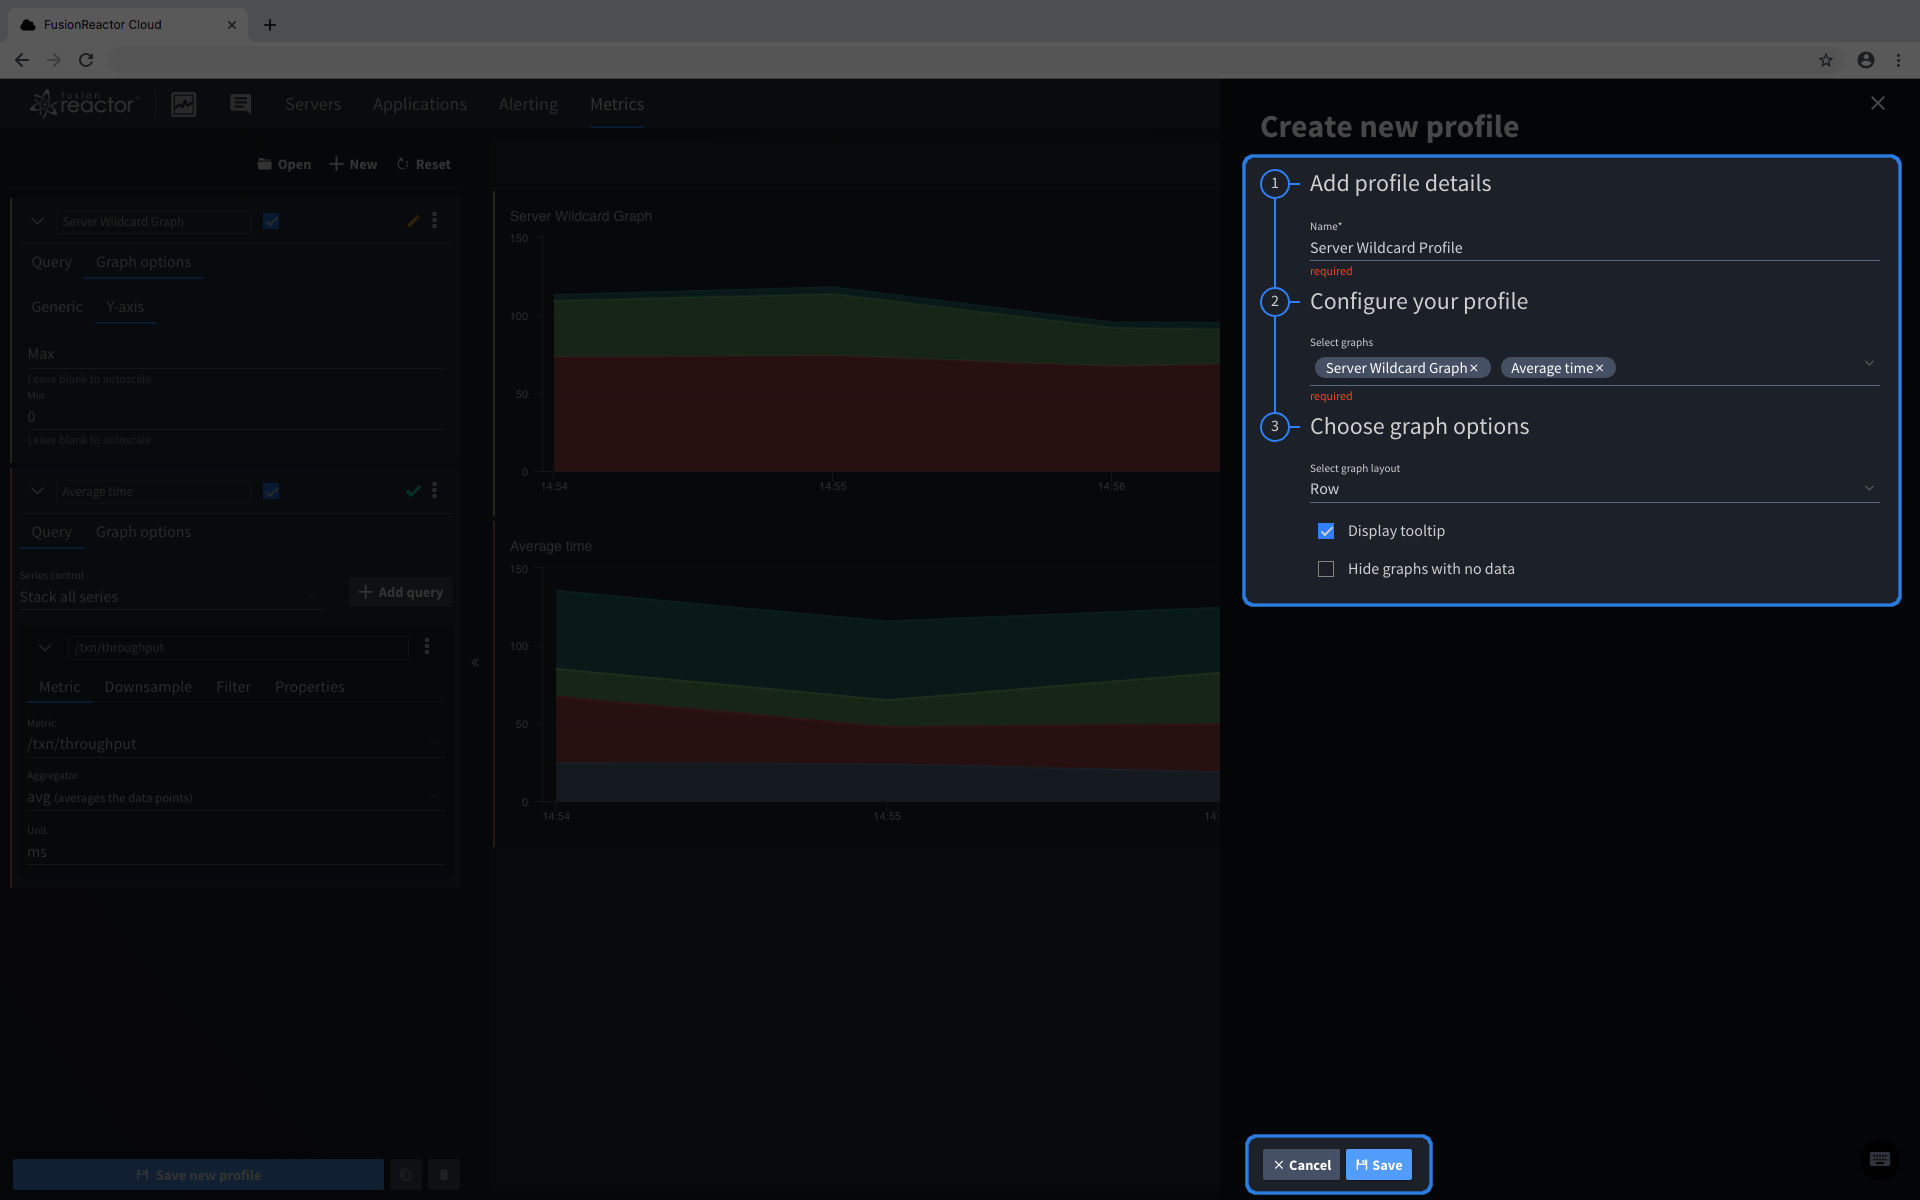
The profile's graphs and other settings will already be set based on what was in the query builder and graph viewing panel when you clicked save. From this screen you can add or remove graphs, or change the settings before saving the profile.
When are you happy with the configuration, you can simply click save to store the profile. Any unsaved graphs will then be automatically saved to your account as well as the profile.
Editing Profiles
Start by finding the profile you wish to edit and opening it. Where the save button at the bottom of the screen once said 'Save new profile' it should now show 'Save' followed by the name of the profile to show it is the profile loaded.
(e.g. 'Server Wildcard Profile' is the last profile loaded into the query builder, so its name appears on the button on the image below).
Clicking on the save button will open a drawer with the same options shown when creating a profile. Any changes made in the query builder or the drawer will overwrite the original profile once saved.
Alternatively, you can select the duplicate button to the right of the 'save profile' button. This will create a "copy" that will be saved separately.
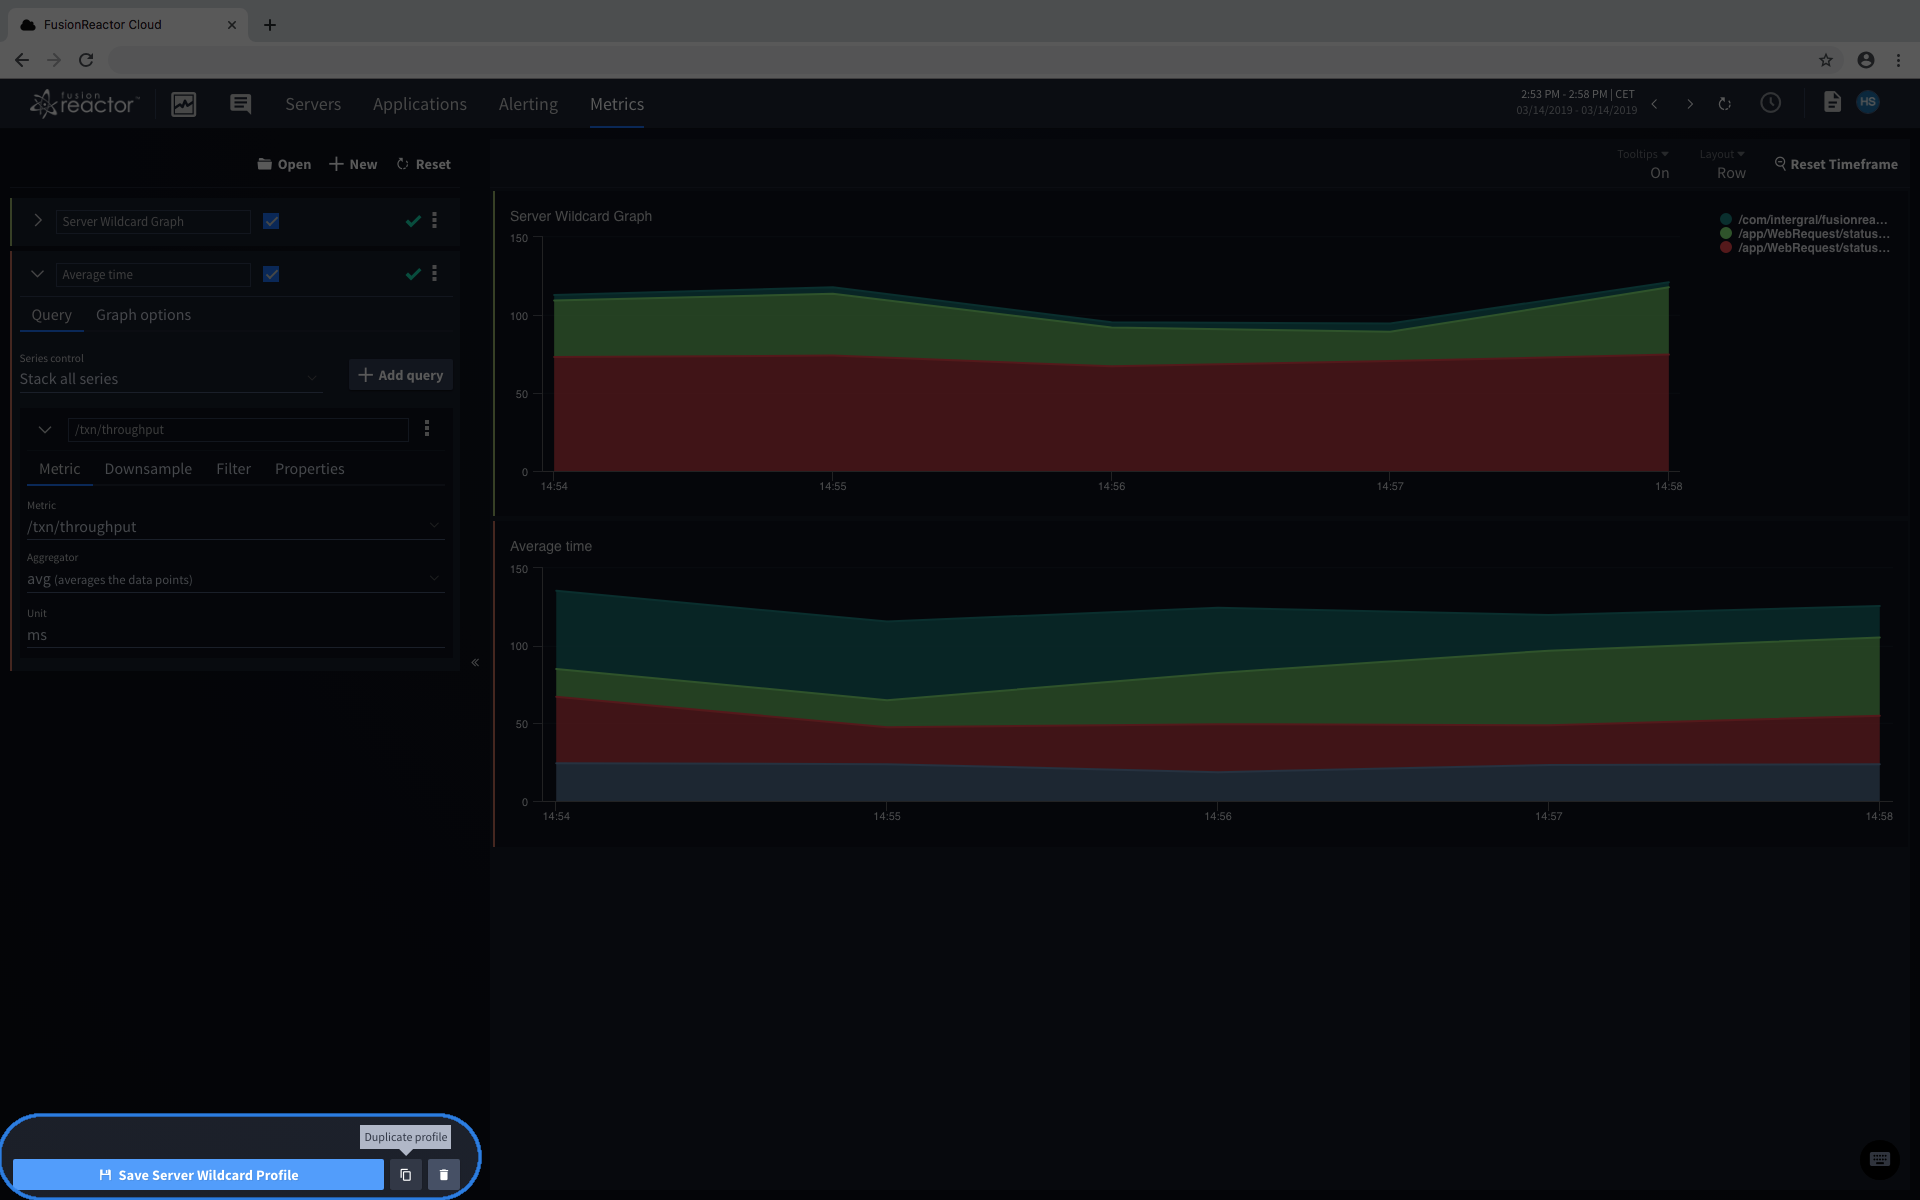
Deleting Profiles
There are two ways to delete a profile. The first is the same as deleting graphs and the second is to use the right-most button of the profile management buttons.
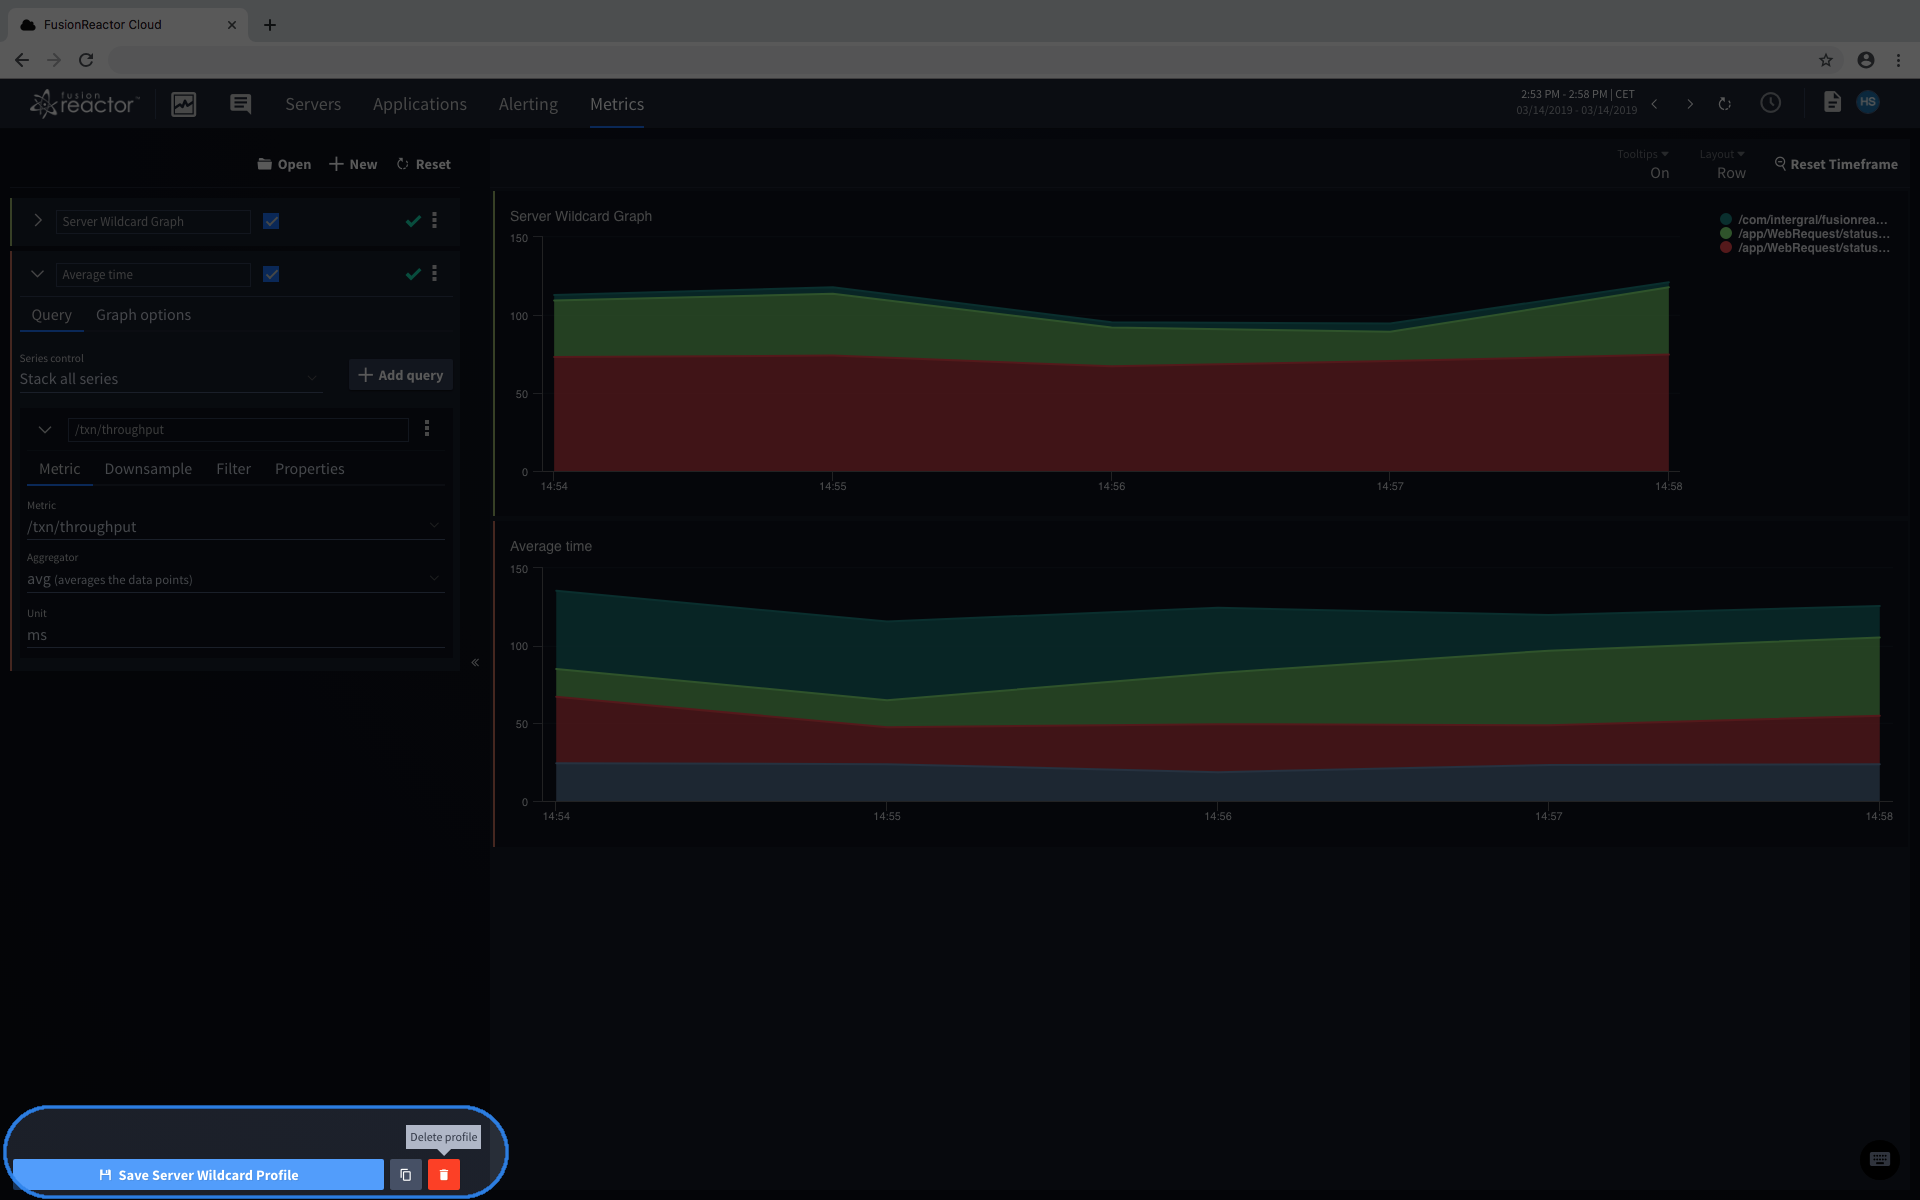
NOTE: You can only user-made delete profiles. Deletion is disabled for 'System' profiles. Profiles cannot be recovered once deleted.
Graph viewers
The graphs shown in a graph viewing window automatically use the time frame that is selected by the time picker.
Changing the time frame of the graphs can be done via the time picker, or it is also possible to zoom into a portion of the graph by 'clicking and dragging' over an area of a graph that you are interested in. This will update the time picker and adjust all graphs (if applicable) that are currently displayed.
You can reset the zoomed in timeframe by simply clicking the Reset Timeframe button located in the top-right of every graph viewer.
Metrics explorer viewing panel
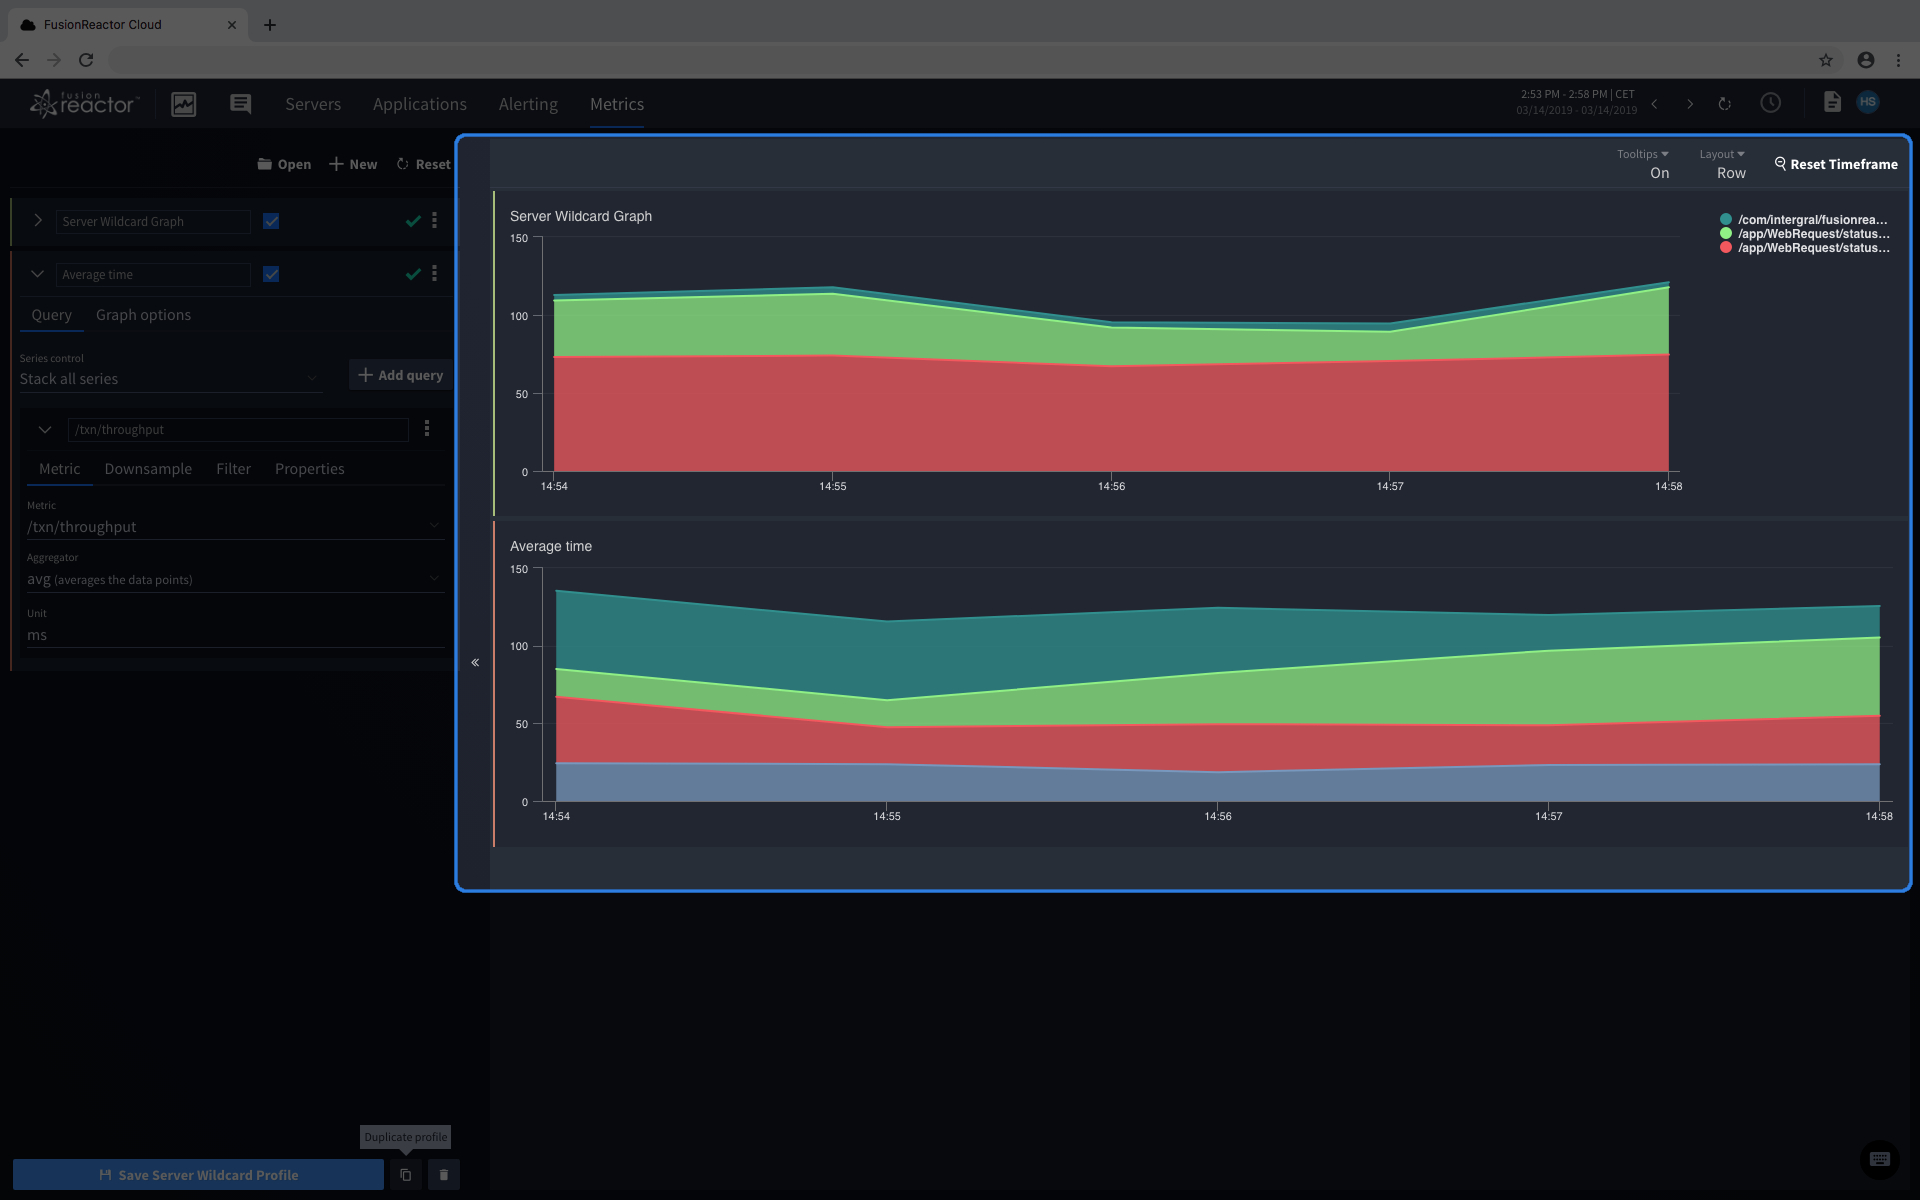
The control bar at the top right of the Graph viewer allows basic configuration of the display. You can toggle the visibility of tooltips on the graphs, or change the layout between row and grid.
Their behaviour is as follows: * Grid * Graphs automatically resize based on the number of graphs to try and fit all of them on-screen. * Beyond 9 graphs the page will expand to be scrollable instead. * If the browser is resized too thin it will set to row automatically
- Row
- All graphs are drawn to take up the full width of the Graph viewer.
- Their height is set to fit 3 graphs on-screen at once.
Server graphs viewer
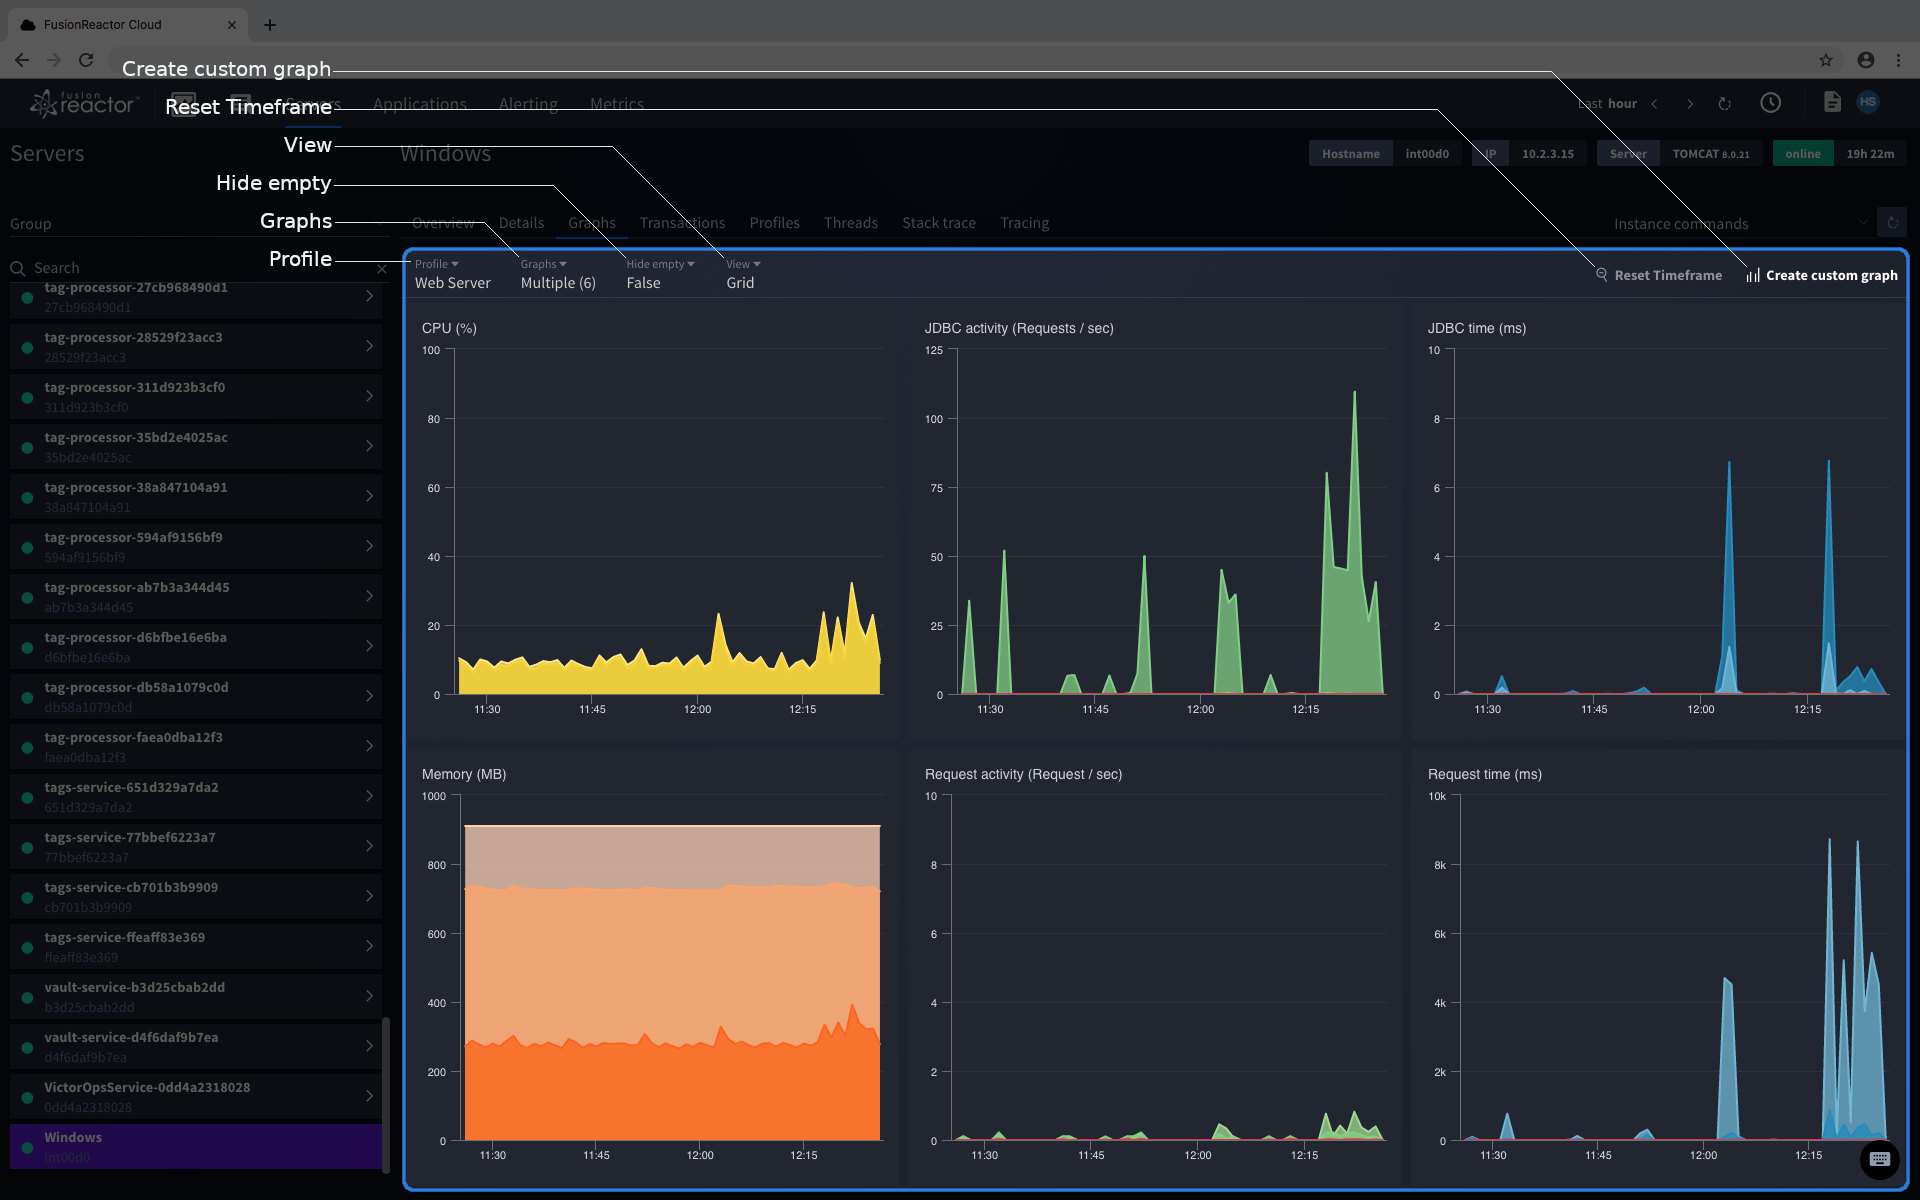
This page can be found under Servers on the 'Graphs' tab.
Profile
This button shows a drop-down that lets you select what profile to display. Changing profile will load the graphs and view setting of the profile. Profiles created in the Metrics explorer can be found under 'Custom'.
Graphs
This button shows a drop-down that lets you select what graph to display. Selecting or de-selecting graphs in this drop-down will cause them to show or hide in the Graph viewer, independently from the currently selected profile. Graphs created in the Metrics explorer can be found under 'Custom'.
Hide empty
A toggle that when set to true, will hide any graphs that have no data within the current time frame. A small message will appear at the bottom of the screen to inform you of how many graphs have been hidden.
View
Allows you to select from the following layouts for the graphs on-screen:
-
Grid
- Graphs automatically resize based on the number of graphs to try and fit all of them on-screen.
- Beyond 12 graphs the page will expand to be scrollable instead.
-
Row
- All graphs are drawn to take up the full width of the Graph viewer.
- Their height is set to fit 3 graphs on-screen at once.
Create custom graph
Opens a compact version of the Metrics explorer. It has all the same features and functionality of the Metrics explorer page without having to leave the Server graph viewer. Changes saved to graphs and profiles will immediately be applied to the ones in the Server graph viewer. New graphs or profiles should appear in their respective drop-down menus.