New UI FAQ
Frequently asked questions about finding features in the new OpsPilot UI.
Where do I find request history?
Request history is available through the UI Tunnel tab on a server. This connects directly to the FusionReactor on-premise agent UI, where you can access the full Requests section including history, slow requests, and error history.
Navigate to Servers, select a server, then open the UI Tunnel tab.
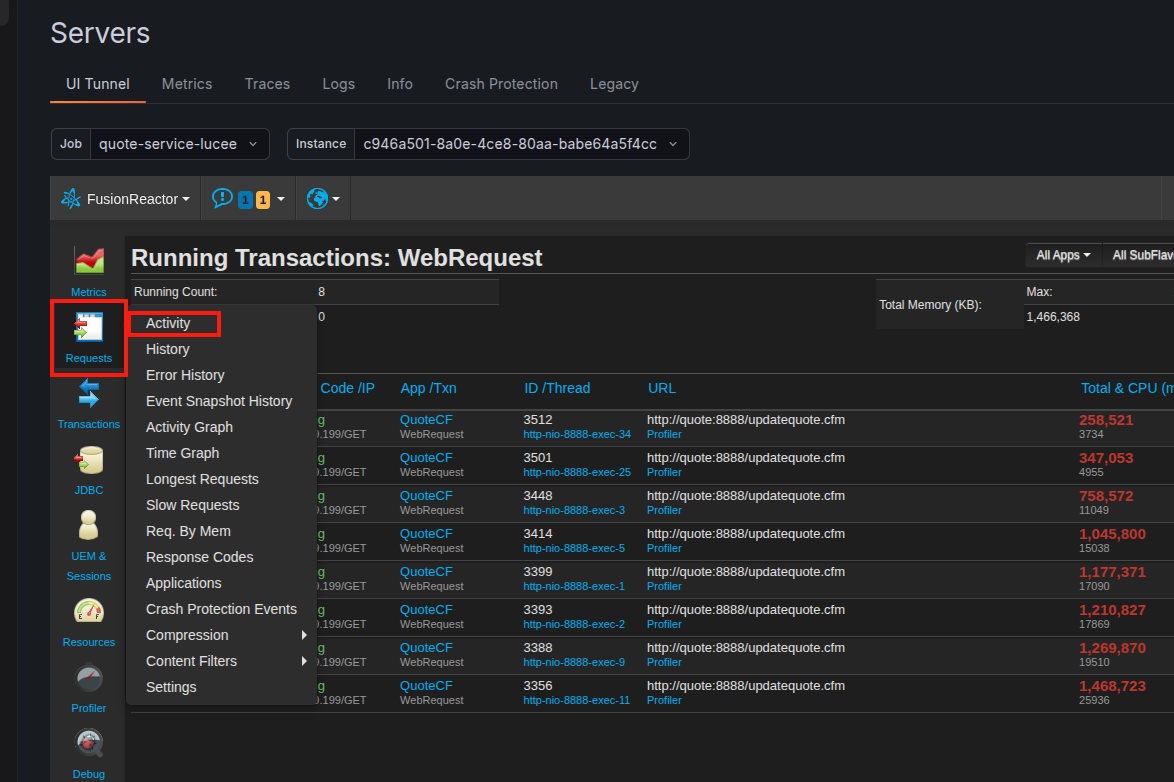
Where do I view running requests?
Live / real-time data Use the UI Tunnel tab on a server, then navigate to Requests > Activity to see all currently running requests in real time.
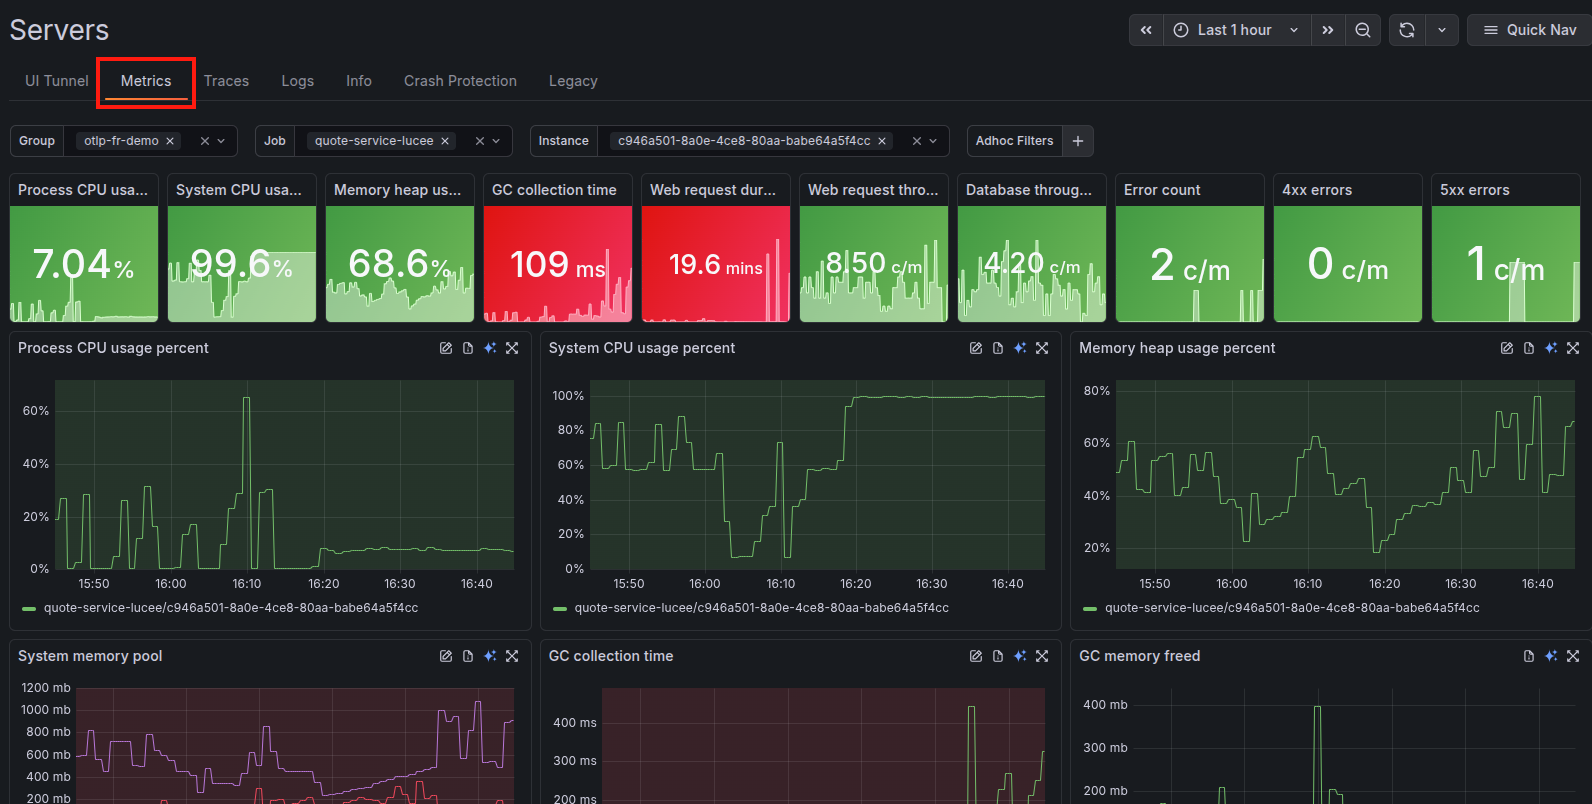
Where do I view metrics graphs?
Metrics graphs are available in two places:
- Metrics tab on a server - select a server, open the Metrics tab, and use the time-frame selector to view metric graphs over your chosen period.
- UI Tunnel tab on a server - for live, agent-level metrics graphs directly from FusionReactor, navigate to Metrics > Web Metrics.
How do I set up alerting?
The new alerting system is built on Grafana Alertmanager and is more powerful than the previous system. Alert rules must be placed in a folder and assigned to an evaluation group.
Learn more
Alerting overview for a full walkthrough of rules, contact points, and notification policies.
How do I purchase a subscription?
To purchase a subscription, navigate to Administration in the left-hand menu and click the gear icon on either the Cloud Trial or On-Premise Subscription box, then select Manage Settings.
How do I update my credit card details?
To update your credit card or billing information:
- Go to Administration > Invoices.
- In the Upcoming Bill panel on the right, click Edit Details.
- Update your card or billing information and save your changes.
Learn more
Invoices for full details on managing your invoices and billing.
The FR tunnel isn't working
If the UI Tunnel tab is not connecting to your FusionReactor instance, the most common cause is a blocked port.
Ensure port 443 is open on the server running FusionReactor. The tunnel uses outbound HTTPS (port 443) to establish the connection.
Learn more
Required endpoints for the full list of hostnames and ports that must be accessible.
Need more help?
Contact support in the chat bubble and let us know how we can assist.