JDBC Time Graph
JDBC > Time Graph displays all the JDBC Transaction performance currently stored by FusionReactor. In the top right of the page next to the Set Home Page you can switch graphs quickly by clicking the Activity button to be switched to the JDBC Activity Graph.
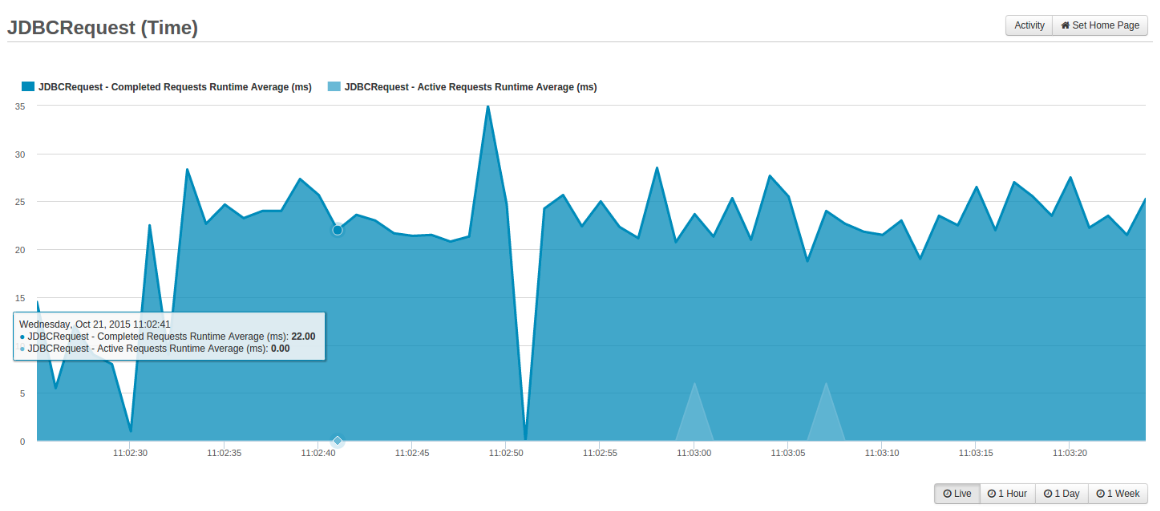
Below is a sample image of the JDBC Time Graph with the tool-tip showing:
Note
The JDBC Time Graph is the same as Transaction->Time Graph but filtered to only show transactions of JDBC type.
Learn more
Need more help?
Contact support in the chat bubble and let us know how we can assist.