Garbage Collection
The Garbage Collection page shows a unified view of garbage collection (GC) in the server.
The page displays three graphs. All the graphs scroll in sequence or show the same time frame, the number of garbage collectors shown in the first two graphs depends upon the garbage collector configured in the Java Virtual Machine (JVM).
Note
The Freed Memory graph only appears in Java versions 1.7 or higher.

Duration Graph
The first graph is the Duration Graph which shows a series per garbage collector in the JVM.
Each time varying graph shows two independent values overlaid :
-
PS MarkSweep Time (ms): Blue
-
PS Scavenge Time (ms): Green
To deselect and reselect each independent value, simply click on their respective names. When a value is deselected (greyed out) then that value is no longer displayed on the activity graph.
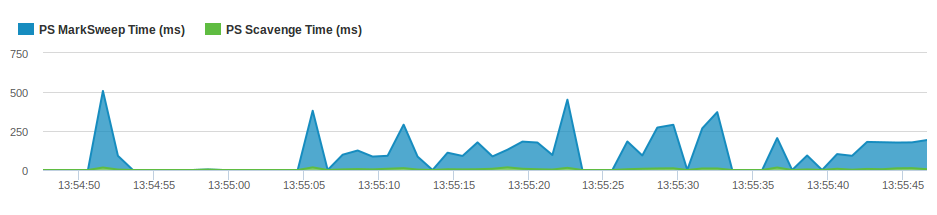
Placing your mouse pointer on a data point within the graph shows a tool-tip with details about that sample, including:
- Date and time of the request
- PS MarkSweep Time (ms)
- PS Scavenge Time (ms)
When browsing the 1 Hour, 1 Day, and 1 Week activity graphs you can select time frames by using the slider under the graph.
Frequency Graph
The second graph shows the number of times each garbage collector is being called by the JVM.
Each time varying graph shows two independent values overlaid:
-
PS MarkSweep Activity (GC/sec): **: Blue
-
PS Scavenge Activity (GC/Sec): Green
To deselect and reselect each independent value, simply click on their respective names. When a value is deselected (greyed out) then that value is no longer displayed on the activity graph.
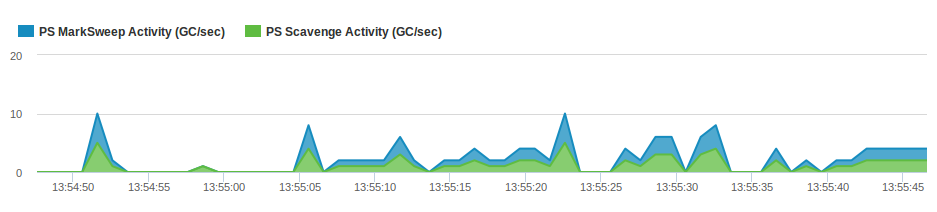
Placing your mouse pointer on a data point within the graph shows a tool-tip with details about that sample, including:
- Date and time of the request
- PS MarkSweep Activity (GC/sec)
- PS Scavenge Activity (GC/sec)
When browsing the 1 Hour, 1 Day, and 1 Week activity graphs you can select time frames by using the slider under the graph.
Freed Graph
The Freed Memory graph will only appear in Java versions 1.7 or higher.
It shows how much memory is being freed by the garbage collection calls over time.
Each time varying graph shows a single independent.
- Freed Memory (MB): Orange
To deselect and reselect each independent value, simply click on their respective names. When a value is deselected (greyed out) then that value is no longer displayed on the activity graph.
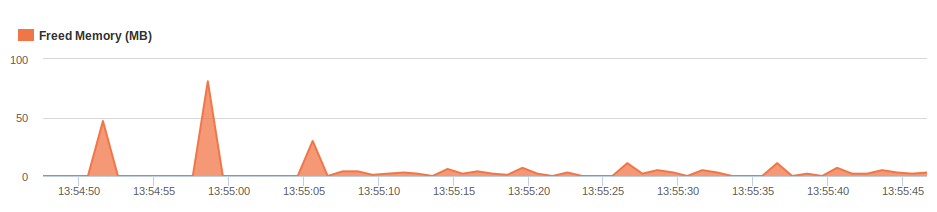
Placing your mouse pointer on a data point within the graph shows a tool-tip with details about that sample, including:
- Date and time of the request
- Freed Memory (MB)
When browsing the 1 Hour, 1 Day, and 1 Week activity graphs you can select time frames by using the slider under the graph.
Garbage Collection Button
Under the graph, to the right of the select time frames there is a Garbage Collection button. This allows you to attempt a force garbage collection and is accompanied by a pop-up notification indicating how much memory was freed in the process.
Need more help?
Contact support in the chat bubble and let us know how we can assist.