Memory Heap
Memory Heap
The Memory Heap page will show you a graph of the memory samples currently stored in memory by FusionReactor.
Below is a sample image of the Heap Memory Graph.
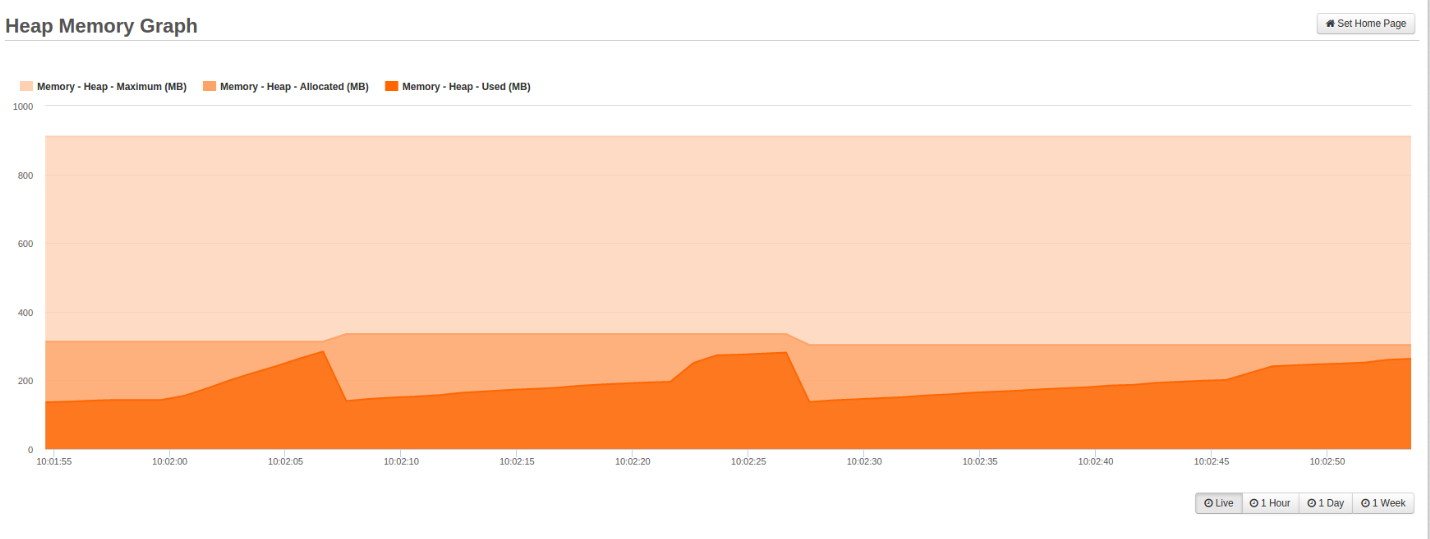
Due to its visual nature, the memory heap graph can very quickly give you a good idea how the system is performing. Not only that but, because it can cover larger periods of time, it can warn you of trends which could become a problem in the future. Trends are much more difficult to spot if you are only checking the system periodically and are only looking at the health of the system right at this point in time.
Memory Heap Graph
Several time spans are available, with differing resolutions. These will be filled as data points that are collected by FusionReactor.
Each time varying graphs shows two independent values overlaid :
Memory - Heap - Maximum (MB)
- This is the maximum memory available for the JVM.
Memory - Heap - Allocated (MB)
- This is the currently allocated memory.
Memory - Heap - Used (MB)
- This is the currently used memory.
To deselect and reselect each independent value, simply click on their respective names. When a value is deselected (greyed out) then that value will no longer be displayed on the activity graph.
Placing your mouse pointer on a data point within the graph shows a tool-tip with details about that sample, including:
- Date and time of the request
- Memory - Heap - Maximum (MB)
- Memory - Heap - Allocated (MB)
- Memory - Heap - Used (MB)
When browsing the 1 Hour, 1 Day, and 1 Week activity graphs you are able to select time frames by using the slider under the graph to pinpoint specific days, times and spikes in your heap memory.
Need more help?
Contact support in the chat bubble and let us know how we can assist.