JDBC Settings
JDBC > Settings allows you to modify various elements and behaviours relating to JDBC. The page is broken up into sections, each containing a table explaining the options that can be chosen in dropdown boxes or input into text fields.
Learn more
Logging / Metrics
JDBC Logging (Log Files)
| Configuration | Description | Default |
|---|---|---|
| JDBC Logging | If JDBC Logging is enabled then each JDBC request and its information will be written to the JDBC log. | Disabled |
| Only Log Queries Slower Than (ms) | Only queries that run longer than this time will be written to the log files. (Optional) | N/A |
| View Size (KB) | This value indicates how much of the log file should be displayed when you view the JDBC log from inside FusionReactor. | 128KB |
| File Size | If the Logging Engine is set to Centralized Archive and Rotation then this field does not appear. However, if the Logging Engine is set to Traditional Per-Log Rotation then this value dictates then maximum size of the log before it is rotated. | 10240KB |
| File Count | As above, this value dictates the number of files held in the log history. An incoming log causes the oldest log to be deleted. | 5 |
Query Parameter Text Logging and Limiting
| Configuration | Description | Default |
|---|---|---|
| Query Parameter Logging | If disabled, prepared statements will appear in their unbound form with ? placeholders. If enabled, FusionReactor will interpret and display each bound parameter. | Enabled |
| SQL Parameter Text Limiting (Log and Display) | Limit the length of individual parameters in an SQL prepared statement to a certain amount of characters. | Disabled |
| Number Of Characters | The number of characters used for SQL Text Limiting. SQL Statements will be limited to this amount when they are logged. | 10 Characters |
Statement Text Limiting (Overall)
| Configuration | Description | Default |
|---|---|---|
| SQL Text Limiting | If enabled, the text of the statement will be limited to the Number of Characters field below. | Enabled |
| Number of Characters | The number of characters to limit the SQL statement to. | 1000 Characters |
Stack trace settings
| Configuration | Description | Default |
|---|---|---|
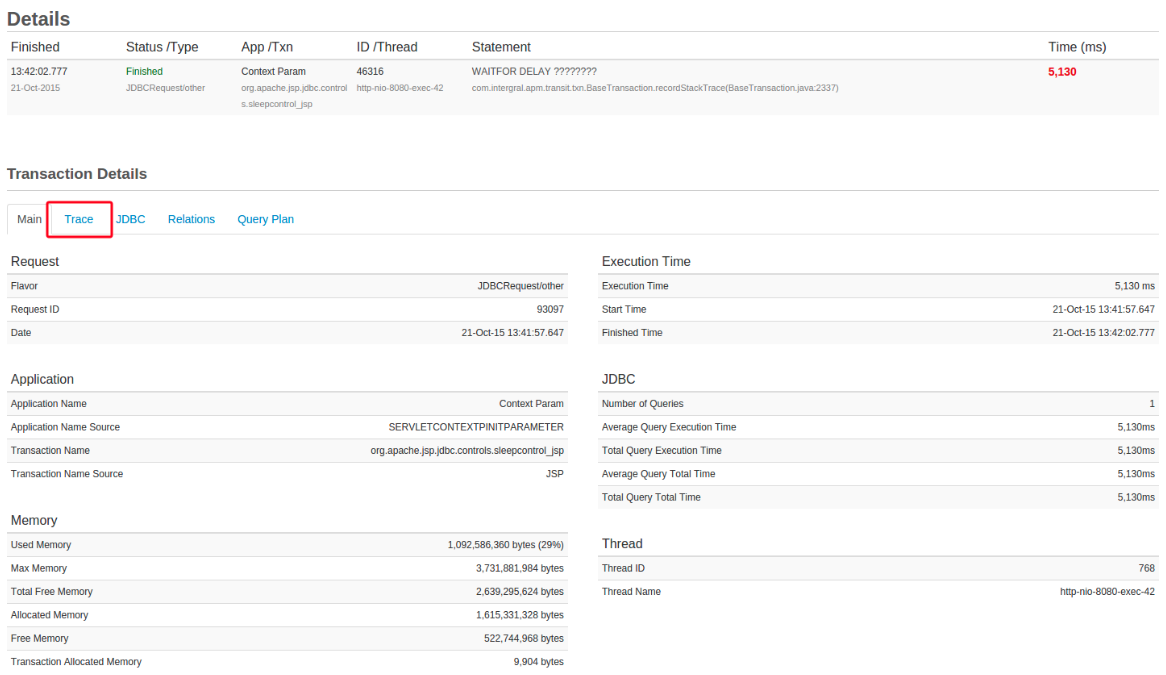
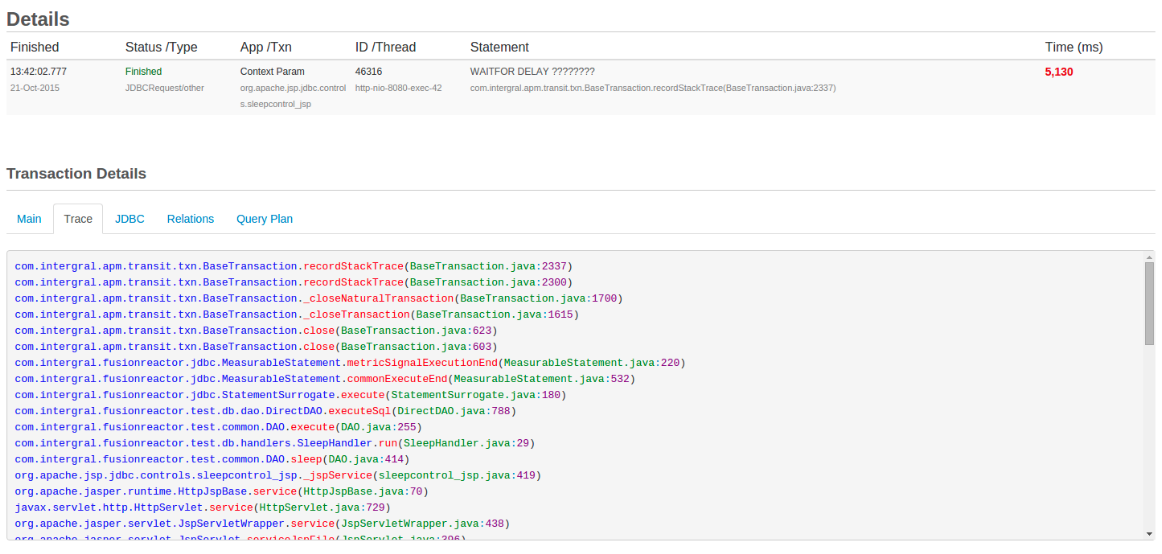
| Query Location | When this feature is enabled and a JDBC request is executed, FusionReactor will store a Java Stack Trace which can be used to find out the location of each query that ran. You change the amount of information which gets stored in this stack trace by going to the Stack Trace Filter page. The resulting stack traces are visible from the Request Details Page page and within the JDBC Log Files. | Enabled |
| Only Record Location On Queries Slower Than (ms) | Only record the location (Stack trace) on queries that run longer than the set time. Recording the location on a query is very fast. However, on systems that run many queries where performance is absolutely critical, you can lower the overhead by only recording the code location of the query for JDBC requests that take longer than a configurable amount of time in ms. (Optional) | 100ms |
Stack Trace Filter
JDBC > Stack Trace Filter lets you set up various filters which are used to make the Java Stack Trace more manageable and readable.
| JDBC Transaction with the Trace tab activated and visible. | JDBC Transaction with the following filter active .java. Therefore, it shows only and all .java file(s) in the stack trace. |
 |
 |
New JDBC Java Stack Trace Filter
The complete Java stack trace contains far more information than you're ever likely to need, so this page has been added to let you tailor it to your own preferences.
To add a new filter, just type a string into the field provided and click the Add Filter Pattern button. Any lines in the stack trace which contain that string will be stored along with the JDBC transaction.
Managing Existing Filters
By default, FusionReactor has the following filters on installation and it will show you any Stack Trace rows which contain references to:
.cfm.cfc.jsp
Here you can see a list of all existing filter patterns. Each pattern has two icons next to it:
| Button | Name | Description |
|---|---|---|
 |
Edit | Clicking this button prefills the Filter Pattern dialogue with the pattern for editing. Click Save Filter when you're done. (Whilst editing any filters you will be unable to delete any filters) |
 |
Delete | Clicking this button deletes the selected filter. |
Transaction Settings
| Configuration | Description | Default |
|---|---|---|
| Obfuscate SQL Data | When obfuscating the SQL data, any of the values within the SQL Statement will be obfuscated replacing the text with ?. See Obfuscate SQL Data below for more details about this feature. | Disabled |
| Transaction is Closed | Specifies when the system will close a JDBC transaction. Select the option most appropriate to the timing data you wish to acquire. See Transaction is Closed below. |
Obfuscate SQL Data
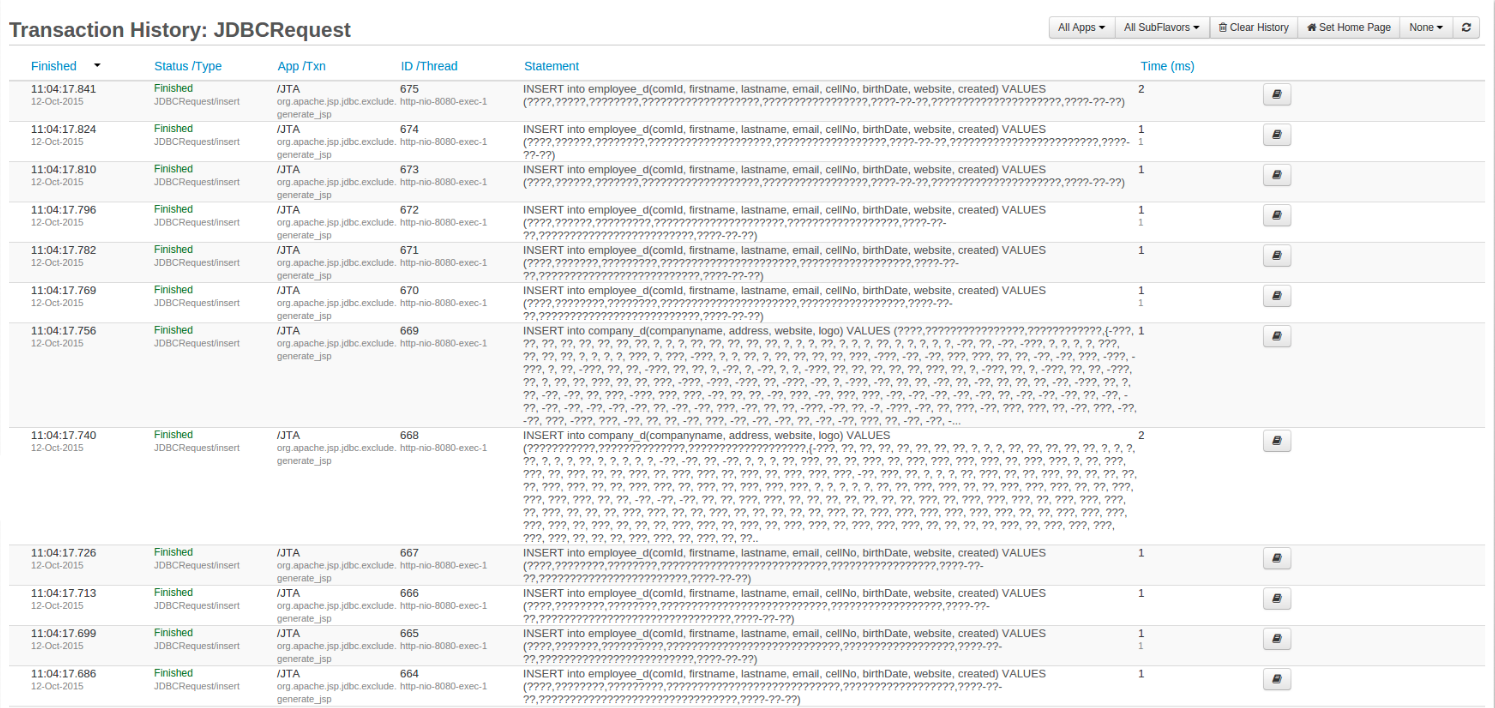
In order to access the JDBC Obfuscation Settings please navigate to FusionReactor > JDBC> Settings > Transactions Settings > Obfuscate SQL Data. There you should be able to find something similar to the screenshot below.
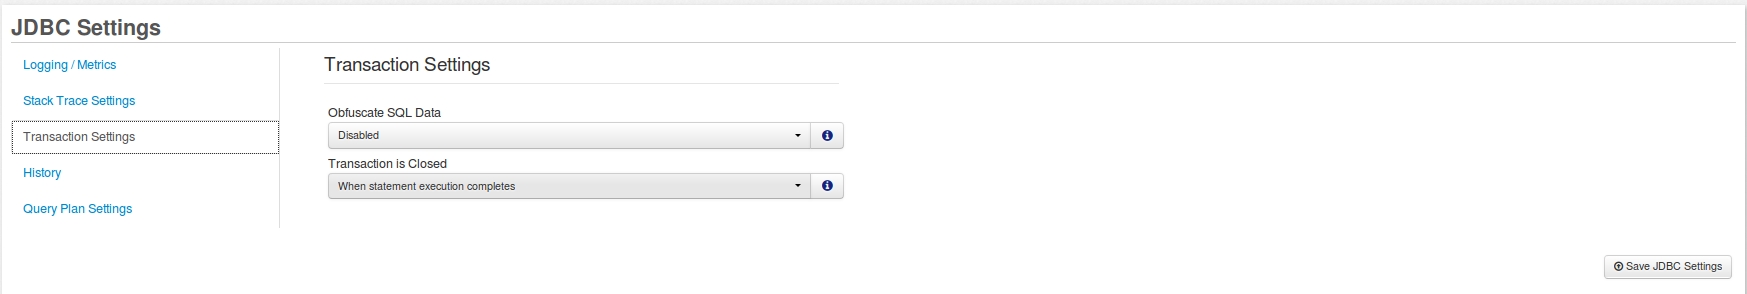
By default, the Obfuscate SQL Data field is set to Disabled. If you decide to set that field to Enabled then that option will allow you to obfuscate ALL the VALUES that are in any request statements that FusionReactor polls.
Note
You have enabled the JDBC.log file on your FusionReactor UI and you'll still be able to see the data without obfuscation. A fix for this issue with be available in future version of FusionReactor.
Disabled
If Obfuscate SQL Data is disabled, then you will be able to see something similar to the screenshot below. All the query VALUES are visible.
Enabled
If Obfuscate SQL Data is enabled, then you will be able to see something similar to the screenshot below. All the query VALUES are not visible and are replaced with a question mark (?).
Keep in mind that the JDBC obfuscation can be enabled or disabled at any point and it will be instantly be reflected on all the stored, current, and any newly created JDBC Requests. Please make sure to save any changes made by clicking the Save JDBC Settings button.
The JDBC obfuscation setting can ONLY be changed by the following two users:
- Administrator
- Manager
Info
Observers will only be able to see the data depending on the obfuscated setting.
Transaction is closed
Specifies when the system will close a JDBC transaction. Select the option most appropriate to the timing data you wish to acquire.
Choosing when to close a transaction alters the timing data for JDBC statements.
When statement execution completes
The transaction closes as soon as the database finishes executing the statement. The timing of the transaction – start / end / duration – is therefore tied solely to the time it took the engine to execute the statement. Use this mode if you are happy with your result set handling, and you suspect the database is slowing you down.
When the first result set closes
The transaction closes as soon as the first result set deriving from it is closed. The timing of the transaction is extended to include both the execution time and the time taken to process and close the result set. Use this mode if you suspect your page is spending too long processing a result set. Caveat: if your statement doesn't have a result set (it might be a delete statement, for instance), then the JDBC transaction will close:
When the statement is closed, or When its parent transaction – probably a Web Request – is closed. In this case, you'll see Cascade Closed as the transaction status, indicating the parent was closed while the JDBC transaction was still open.
If your statement produces multiple result sets, all subsequent sets will be counted for aggregates (Row count etc.) but only the first will be used for transaction timing.|When statement execution completes|
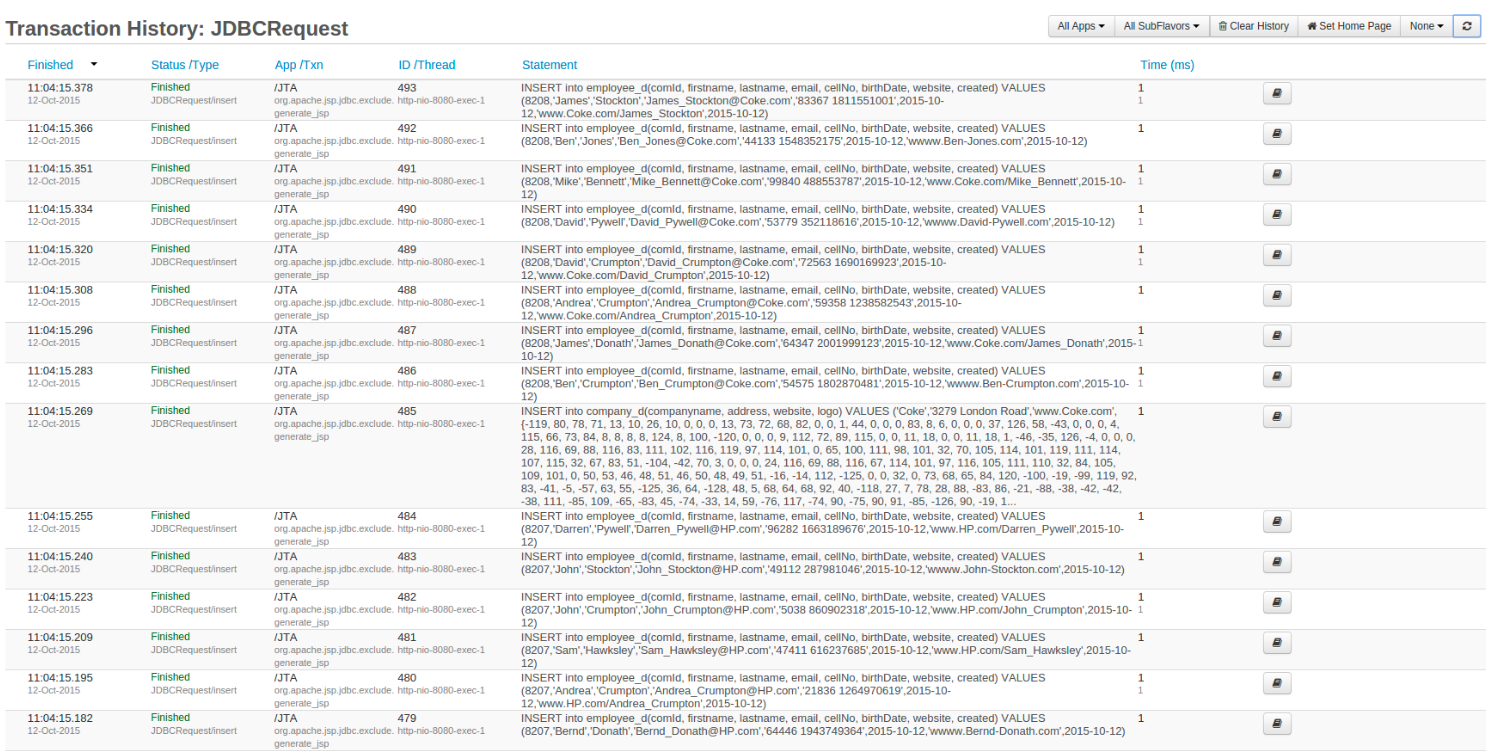
History
| Configuration | Description | Default |
|---|---|---|
| History Size | The number of JDBC requests FusionReactor keeps in memory. This does not effect the size of the JDBC log file. | 100 |
| Slow Request History Size | This is the number of requests which will be shown on the Longest JDBC Requests page. | 100 |
| Slow Request Threshold | Once a request has run for longer than specified here, it is considered a slow running request. Any request over 3 seconds is considered slow. | 3 Seconds |
| Query Storage Strategy | This will determine how the sub transactions are stored on their parent. See below | Slowest X |
| Query Limit (X) | This is the X value used in the storage strategies. | 30 |
Storage Strategies
The Storage Strategies are defined as follows:
- First X: Store the first X transactions that come in. Where X is the value of Sub Transaction Limit.
- Slower Than X: Store only those transactions that exceed X. Where X is the Slow Request Threshold.
- Slowest X: Store the slowest X transactions. Where X is the value of Sub Transaction Limit.
- Summary Only: Store only a summary of the transactions. The duration and any aggregates will be stored, but no sub transactions.
Query Plan Settings
Automatically generate the query execution plan for long running JDBC calls.
| Configuration | Description | Default |
|---|---|---|
| JDBC Explain | When enabled, slow JDBC calls will trigger the query plan generation. | Disabled |
| Query Plan Duration Threshold (secs) | Once a request has run for longer than specified here, it is considered a slow running request and will trigger the Query Plan generation. Any request over 3 seconds is considered slow. | 3 Seconds |
Need more help?
Contact support in the chat bubble and let us know how we can assist.