Event Snapshot History
This page tracks the last (n) transactions which had an Event Snapshot generated and attached to the transaction.
Info
The transactions can be filtered by flavor and subflavor.
Event Snapshots are generated for specific events that may occur whilst FusionReactor (FR) monitors your application. They are intended to provide deep level insight whenever a problem, such as an exception or thread latency occurs.
Info
Snapshots are triggered automatically.
The Event Snapshot displays source code, scope variables, stack trace and logging information at the point the problem occurs; providing everything you need to isolate the issue as quickly and efficiently as possible. They fill the gap between simple error tracking (stacktrace) and the full interactive debugger (allowing step through control within your code and the ability to modify variables).
Info
These are generated when a log error call is made (and FR tracks it) or an exception occurs on the transactions and is tracked.
Event Snapshots require that the native Debug library is installed, as this is the only API that allow us to interrogate the java local variables on the callstack. These snapshots contain variables and the thread stack trace when specific events occur. If you install FR using the Automated installer, the native Debug library is automatically be installed - otherwise, this library will need to be installed manually.
Rate limiting
Event Snapshots are shared to reduce the amount of storage used. For example, if you have three WebRequests which all have the same error they all share the same event snapshot file. In this case the first WebRequest generates the event snapshot file and the other two simply reference the original. This means that the UI could show variables which don't match the current WebRequest because it was generated for a earlier WebRequest.
Sharing of the Event Snapshot means if you have a re-occurring problem the generation is only performed once and all duplicates simply reference the original. This drastically reduces the overhead of the generate when transactions are failing in tight loops.
Variable capture
When an Event Snapshot is created it captures the local variables and stack trace of a specific thread. Variables are gathered for each call stack frame.
Note
Packages that start with java, javax, sun or com.intergral do not get any variables captured.
Local variables are captured at each applicable stack frame, these variables that are captured will include all objects fields variables and this continues down the variable / field hierarchy for up to five levels.
The Event Snapshot has a hard limit of 500 unique variables. Once this is hit no more variables will be captured. Collections, Maps, Lists and Arrays etc only track the first five objects in the data structure. If we don't limit these data structures they instantly hit the max variable limit making the Event Snapshots pretty useless.
Log Event Snapshots
FusionReactor captures the last n (100 by default) log messages of a specific level or higher (defaults to ERROR). By default we capture ERROR log messages or higher from log4j, slf4j and apache commons logging.
Note
We do not track Java Util Logging.
Event Snapshots are generated on the first log ERROR call. This captures all the stack variables and the call stack when this error is called This allows the developer to know when a log error statement was triggered and why.
Learn more
Exception Snapshots
Event Snapshots can be generated when an error is tracked in FR. When an error occurs FusionReactor then remembers that this error caused a page / transaction to fail. The second time this exception occurs it triggers an Event Snapshot to be generated. This includes the variables and stack at the time the exception is thrown. Unlike the place where the exception is raised to the user, this first chance exception captures exactly the state that triggers the issue where the Error tracking in FR only tracks when the error is passed all the way up and shown to the user.
On disk storage & limits
Event Snapshots are not stored in memory as they can be very large. We stream the information to a file on disk. This streaming event snapshot file requires very little memory to generate but does require disk space and disk IO so slow disks could affect performance.
The number of files stored on the disk can be limit by a number to retain or a maximum disk usage in KB.
Learn more
Enabling support for Event Snapshots
Event Snapshot (Exception) support can be switched on by configuring the following system property in the JVM arguments file:
1 | |
Once enabled, Event Snapshots are triggered when exceptions occur, otherwise snapshot generation will not trigger on exceptions / errors.
Enabling in the User Interface
Before Event Snapshots can fire, they need to be enabled in the User Interface. This is done from the Debug menu, on the Event Snapshot tab.
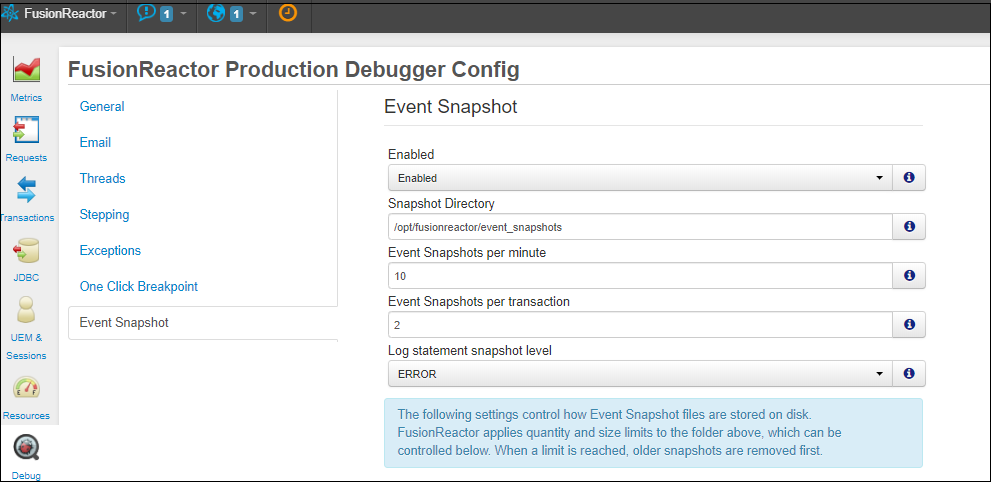
User Interface
Above is an example of the Event Snapshot UI. This Event Snapshot was triggered from the second attempt to call postgresql. The first triggers an error to be tracked on a transaction, then the second call triggers the Event Snapshot generation when the exception is first thrown.
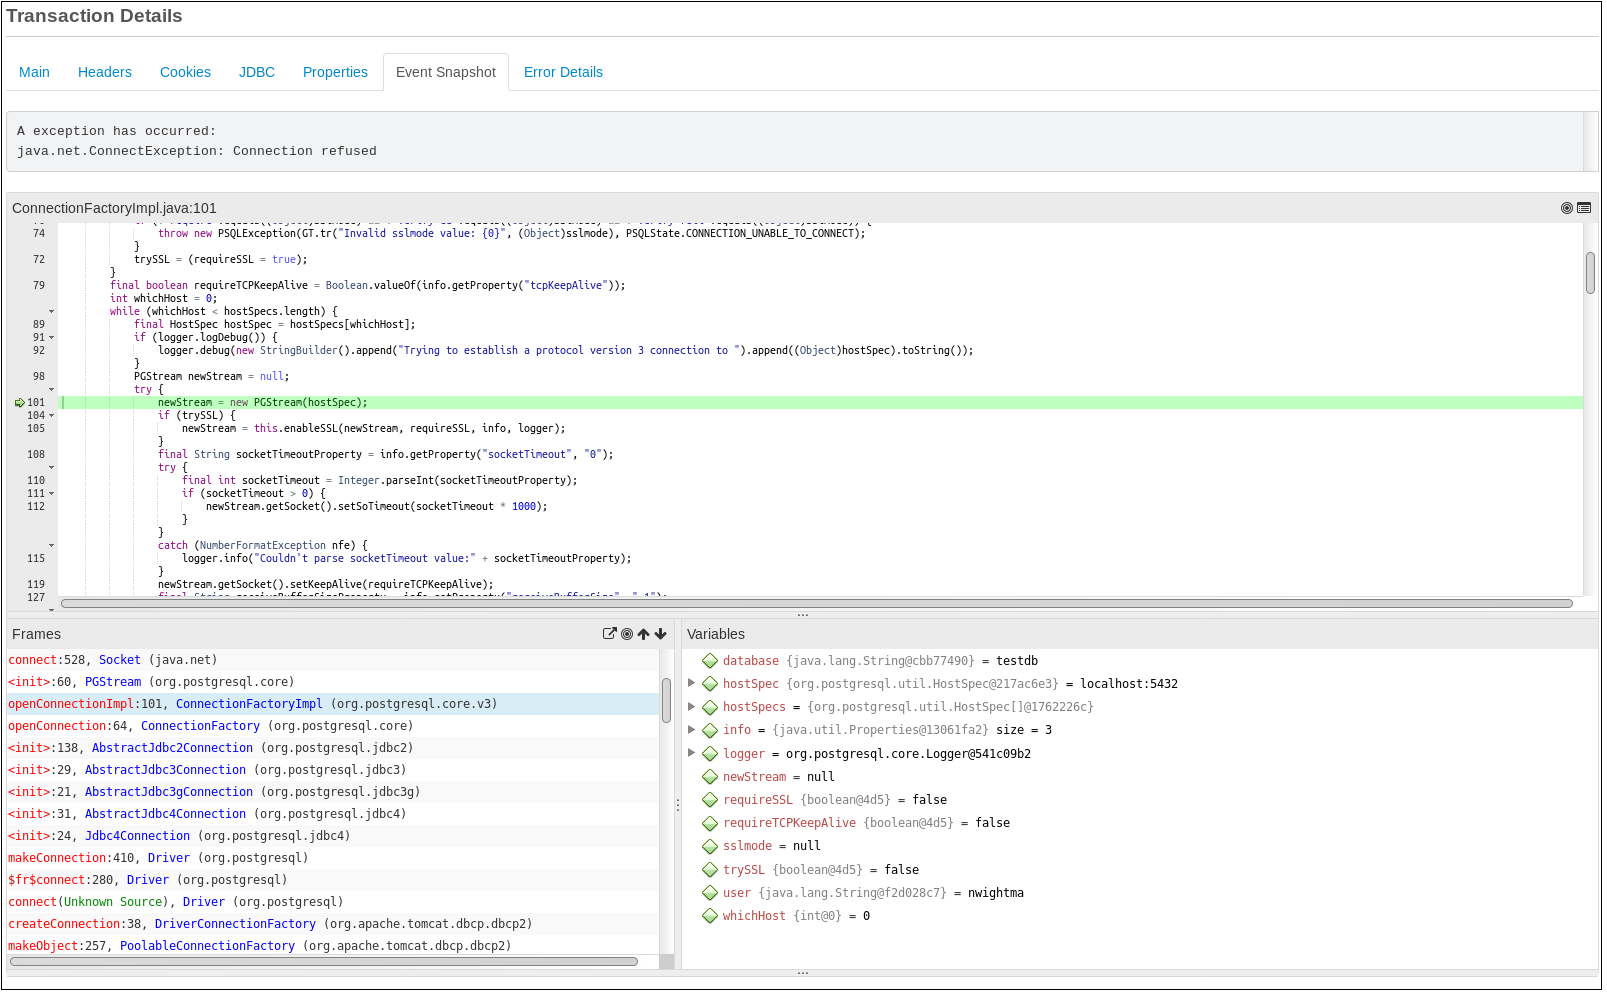
This is very similar to the Interactive Debugger UI. The UI shows information at the top showing what caused the generation and why. In this example it's an exception being thrown. The lower section matches the Interactive Debugger, showing the source code, stack trace frames and variables (if any have been captured).
Why are Some Variables not shown?
In this case the socket connect is in the low level code of java which doesn't have any variables captured so I have to select the first stack frame which has variables (org.postgresql.core.v3.ConnectionFactoryImpl). On the right you can see exactly the variables which are being used to connect:
-
database = testdb
-
hostSpec = localhost:5432
-
user = nwightma.
Tip
These objects can be expanded to show their fields.
Selecting the stack frame which corresponds to my code displays:
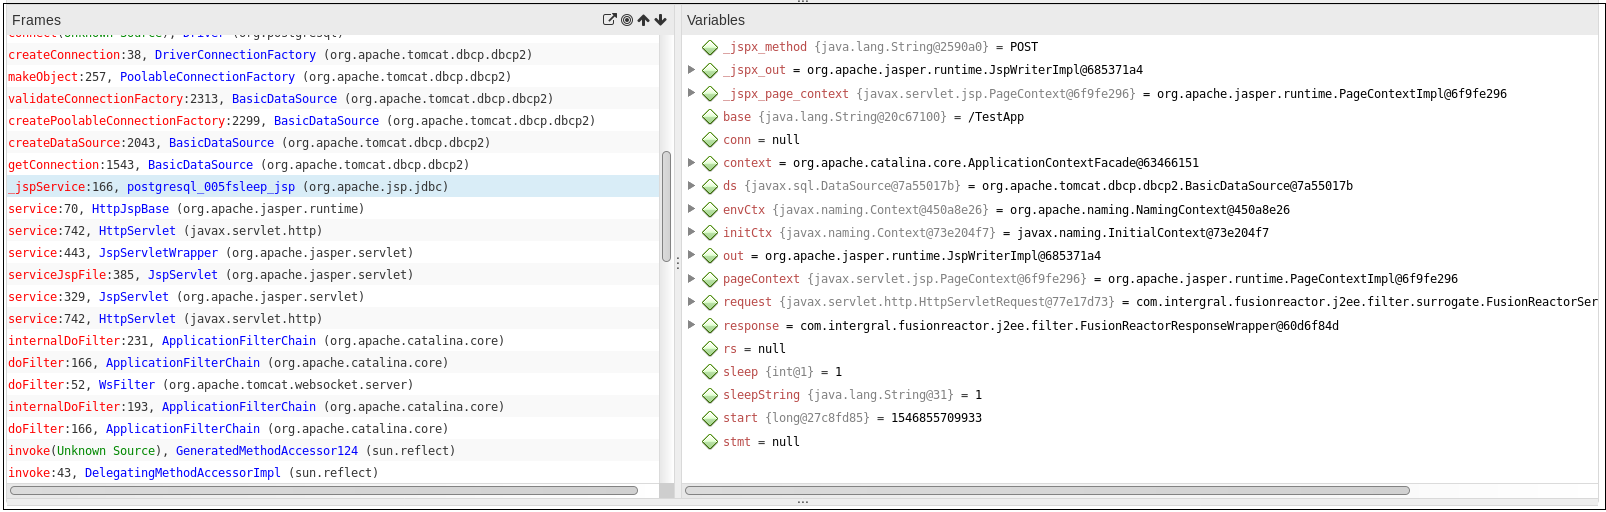
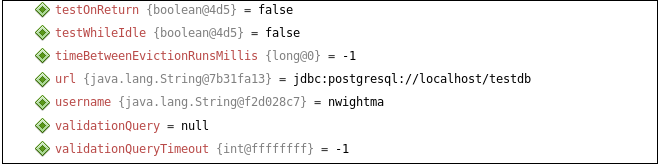
Much of the information appears to be missing, but simply expanding the 'ds' field displays:
Need more help?
Contact support in the chat bubble and let us know how we can assist.