Slow Transactions
The Slow Transactions page displays the transaction of the selected type that are currently stored in the memory that have a run time that is longer than the threshold limit (8 seconds by default).
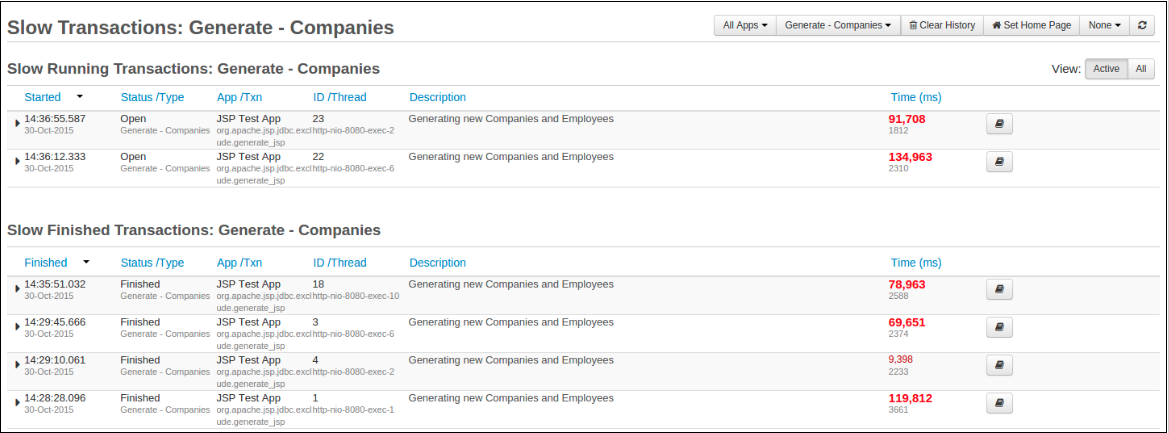
The Slow Requests page shows a list of currently running and finished requests which have taken longer to run than the current Slow Request Threshold which is defined on the Request+Settings
Slow Running Transactions Table
The **Slow Running Transactions table is useful if there are a very large number of requests running on the server, so that you can filter and only display long running requests.
| Name | Description |
|---|---|
| Started | The time and date at which the transaction started. |
| Status / Type | The status of the transaction and its transaction type. |
| App / Txn | The application in which the request occurred from or to. |
| ID / Thread | The transaction ID and the name of the thread which is servicing the transaction. |
| Description / URL / Statement | This column contains the location and details of the transaction. Depending on the flavor of the transaction, you will see either Description, URL or Statement. |
| Time (ms) | The time that the transaction took to complete. If available then you will also see the amount of actual CPU time that this transaction used below it |
Slow Finished Transactions table
The Slow Finished Transactions table has the following columns:
| Name | Description |
|---|---|
| Finished | The time and date at which the transaction finished. |
| Status / Type | The status of the transaction and its transaction type. |
| App / Txn | The application in which the request occurred from or to. |
| ID / Thread | The transaction ID and the name of the thread which is servicing the transaction. |
| Description / URL / Statement | This column contains the location and details of the transaction. Depending on the flavor of the transaction, you will see either Description, URL or Statement. |
| Time (ms) | The time that the transaction took to complete. If available then you will also see the amount of actual CPU time that this transaction used below it |
Sorting Slow Transactions
The order in which transactions are displayed can be changed on this page by clicking on any of the column titles. Clicking on a title for a second time will reverse the order on that column.
There are filters present at the top of the page, and you are able to switch between active transactions and all transactions running.
| Name | Description | Default |
|---|---|---|
| Apps | The application you wish to view | All Apps |
| Transaction | The type of transaction you wish to view (e.g. Root Transactions, All Transaction or specific types like WebRequest, JDBC Requests, etc.) | Root Transactions |
| SubFlavor | The type of requests you wish to view (e.g. GET, POST, Create, Insert, etc.) | All SubFlavors |
| View | Allows you to view only transactions that are either Active or All | Active |
This allows you to get a better overview of your applications and which transactions have taken the longest time to complete.
Root Transactions are all top level root transactions, i.e. they have no parent transactions. They normally mean that this is the start of some operation which FusionReactor tracks.
All Transactions are all the transactions which FusionReactor tracks, this includes Root Transactions and all the child / sub transactions.
Managing Requests
As described above, the Managing Requests page allows you to view all the different transactions by selecting other types of transactions via the drop down selector in the top right. Therefore, the following buttons and options may not appear for all of the transactions.
Note
The following options are only available for running requests.
-
Stack Trace
-
Request Detail
-
Stop Tracking
| Button | Name | Description |
|---|---|---|
| Stack Trace | Takes you to the Stack Trace page, allowing you to see the current Java stack trace of the request.The request must be being currently executed to be presented with this option. | |
| Details | Takes you to the Request Details page, allowing you to access all information associated with a request; e.g cookies, JDBC, headers, User Trace Markers and AMF data. | |
| Kill | Clicking this button allows you to manually kill any tracked request. You'll be asked to confirm. Click OK to kill the request. Warning - Kill Instability with Java 1.5+. FusionReactor's Request Kill (Accessible via the Kill Request button, the Kill ALL button and via Protection strategies) uses our Transit transaction engine to make two attempts to kill a request. Soft Kill, this interrupts the request while it's outputting data to the web browser. If the request is not outputting data (It might be stuck in a loop or a Java native method for instance), the Soft Kill will time out. FusionReactor then proceeds to a Hard Kill. Hard Kill is FusionReactor's last resort. The thread is interrupted, paused and then stopped. Any Java synchronizers (Monitors) the threads that are held are immediately released. However, in Java 5, Sun/Oracle introduced a new type of lock, the Ownable Synchronizer. These locks are much more versatile, but FusionReactor cannot manipulate them, and killing their owning threads may not automatically release them. In this case, a thread kill will almost certainly eventually lead to a system hang, as other threads wait for a lock release that will never happen. If FusionReactor detects that the candidate request owns any ownable synchronizers, it will not proceed to a hard kill in order to preserve the integrity of the locking system. If you use the user interface to Force Thread Death, FusionReactor will attempt the hard kill, but any locks will not be released (You could end up with a system hang. Use this feature with caution). If you're using Protection rules set up to abort requests – for example the Request Runtime Protection, FusionReactor won't automatically proceed to hard kill. You'll be able to identify these requests in the request history lists, because they will have a tab called Transit - Locks, listing the locks that the request owned. |
|
| Add to CP | Takes you to the Protection Restrictions page which will be filled out for this request. | |
| Stop Tracking | Causes FusionReactor to stop tracking this request for certain metrics (slowest requests, request runtime. request activity). Once this button has been pressed, it is grayed and disabled. There is no way to reverse this operation. |
Clearing Request History
On the menu bar, in the top right of the page there is a Clear History button. Clicking this button deletes any information from the page you are on.
| Button | Name | Description |
|---|---|---|
| Clear History | Clicking this button will clear the page of all requests and its history |
Need more help?
Contact support in the chat bubble and let us know how we can assist.