Databases & other languages
Step 1: Install the Observability Agent
The Observability Agent provides you with the necessary tools and insights to effectively monitor, manage, and optimize your applications, leading to improved reliability, performance, and user experience.
Info
How to install the observability Agent locally from FusionReactor APM on Vimeo.
Windows
View more
To download and run the installer, open powershell admin terminal, navigate to your desired download folder and run:
Invoke-WebRequest -Uri "https://github.com/intergral/observability-agent/releases/latest/download/observability-agent-autoconf.ps1" -OutFile "observability-agent-autoconf.ps1"
.\observability-agent-autoconf.ps1
Info
The installer for Windows assumes you are installing Grafana Alloy in the default location on the C drive. This is required for the config file to be placed in the correct location for Grafana Alloy to read it.
Linux
View more
To download and run the installer, in a terminal, run:
Further options
Learn more
Further options are available when installing the Observability Agent.
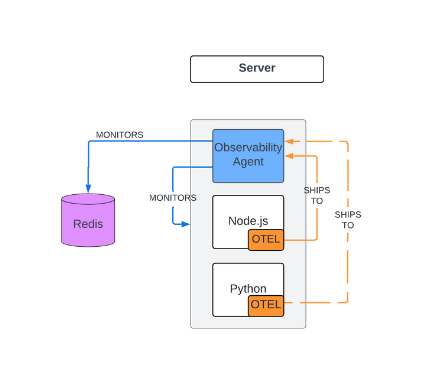
Step 2: Instrument OpenTelemetry
Instrument your code to support OpenTelemetry on your application (Node.js, Python, Go etc).
Learn more
Configure the endpoint of the OTel application to the Observability Agent at either http://localhost:4317 or http://localhost:4318 of your machine (depending on whether you're using gRPC or HTTP). This ships telemetry data to the Observability Agent, which does the cloud shipping for you.
Note
It is possible to use a dedicated OTel collector or alternative if required, but the Observability Agent is the simplest method for shipping telemetry data.