Overview
The FusionReactor Production Debugger is available in the Ultimate(6.0+), Developer, and Trial Edition. It provides deep insights into code execution at runtime with a production-safe debugging approach.
Key Features:
-
Built-in IDE-Style Debugger
- Set breakpoints and modify variables at runtime
- View source code (when configured in the Sources panel)
- View decompiled code for classes without source
- Step into, out of, and over code execution
- Traverse the stack
-
Breakpoints & Alerts
- Source code and line-specific breakpoints
- Java Method Entry & CF Function Entry breakpoints
- Field access/modification breakpoints
- Exception thrown/caught breakpoints
- Conditional breakpoints & rate limiting
- Breakpoint Email Alerts – Get notifications with stack traces and variable context
-
Additional Debugging Tools
- Breakpoint Samplers – Capture debugging data without disrupting execution
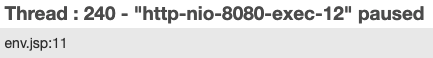
The Debugger is accessible from the left navigation bar in FusionReactor. Paused threads are indicated by an icon in the top navigation bar:

Breakpoints can be set from the debugger page, stack traces, error details, or via the New Breakpoint button when viewing paused thread details.
Interactive debugger
The FusionReactor Production Debugger allows you to pause threads and inspect them in an interactive debugger.
You can access the interactive debugger from:
- The Debugger page by clicking the debug icon on a paused thread.
- A running request or transaction with a paused thread.
- The Resources → Threads page by selecting the debug icon on a paused thread.
The Debugger page provides an overview of source and class files, configured breakpoints, and paused threads, allowing for efficient debugging and issue resolution.
This page is split into 4 sections:
- Source Files and Class Files Viewer (top left)
- Source Code and Decompiled Class Viewer (top middle)
- Breakpoint Viewer (the top right)
- Paused Threads Overview (bottom)
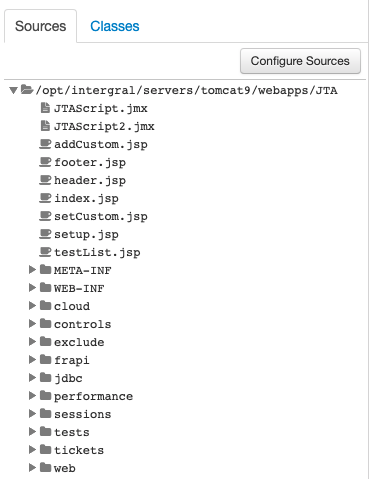
Sources / Classes
The source files tree viewer allows you to browse and select files from configured source directories to view in the code viewer. Similarly, the class files viewer lets you select and decompile classes loaded into the JVM for inspection.
You can seamlessly switch between source files and class files using the tabs at the top of the section.
Learn more
Source Code
When a file is selected from either the source file viewer or the class file viewer, it will be rendered here.
Note
Some file types won’t render when clicked. To enable a specific file type, set the system property:
-Dfr.jvmti.debugger.enabled.files=.comma,.separated,.list
This allows rendering in the source code viewer.
With FusionReactor 7, you can now set breakpoints by clicking in the margin of the Decompile UI and the Paused Thread Page source code viewer. Clicking on an empty margin space creates a new breakpoint.
You can configure the Fire Count and Pause Time for interactive breakpoints in Debug → Settings → One-Click Breakpoint Settings or by clicking the gear icon in Debug → Debugger.
- Clicking an existing breakpoint removes it.
- Shift-clicking an existing breakpoint disables it instead of deleting it.
Breakpoint
The breakpoint section shows currently configured breakpoints.

The information button (i) can be used to view details about the breakpoint. Edit (to the right of information) can be used to edit the configuration of the breakpoint. The red cross (rightmost button) can be used to remove the breakpoint permanently.
Learn more
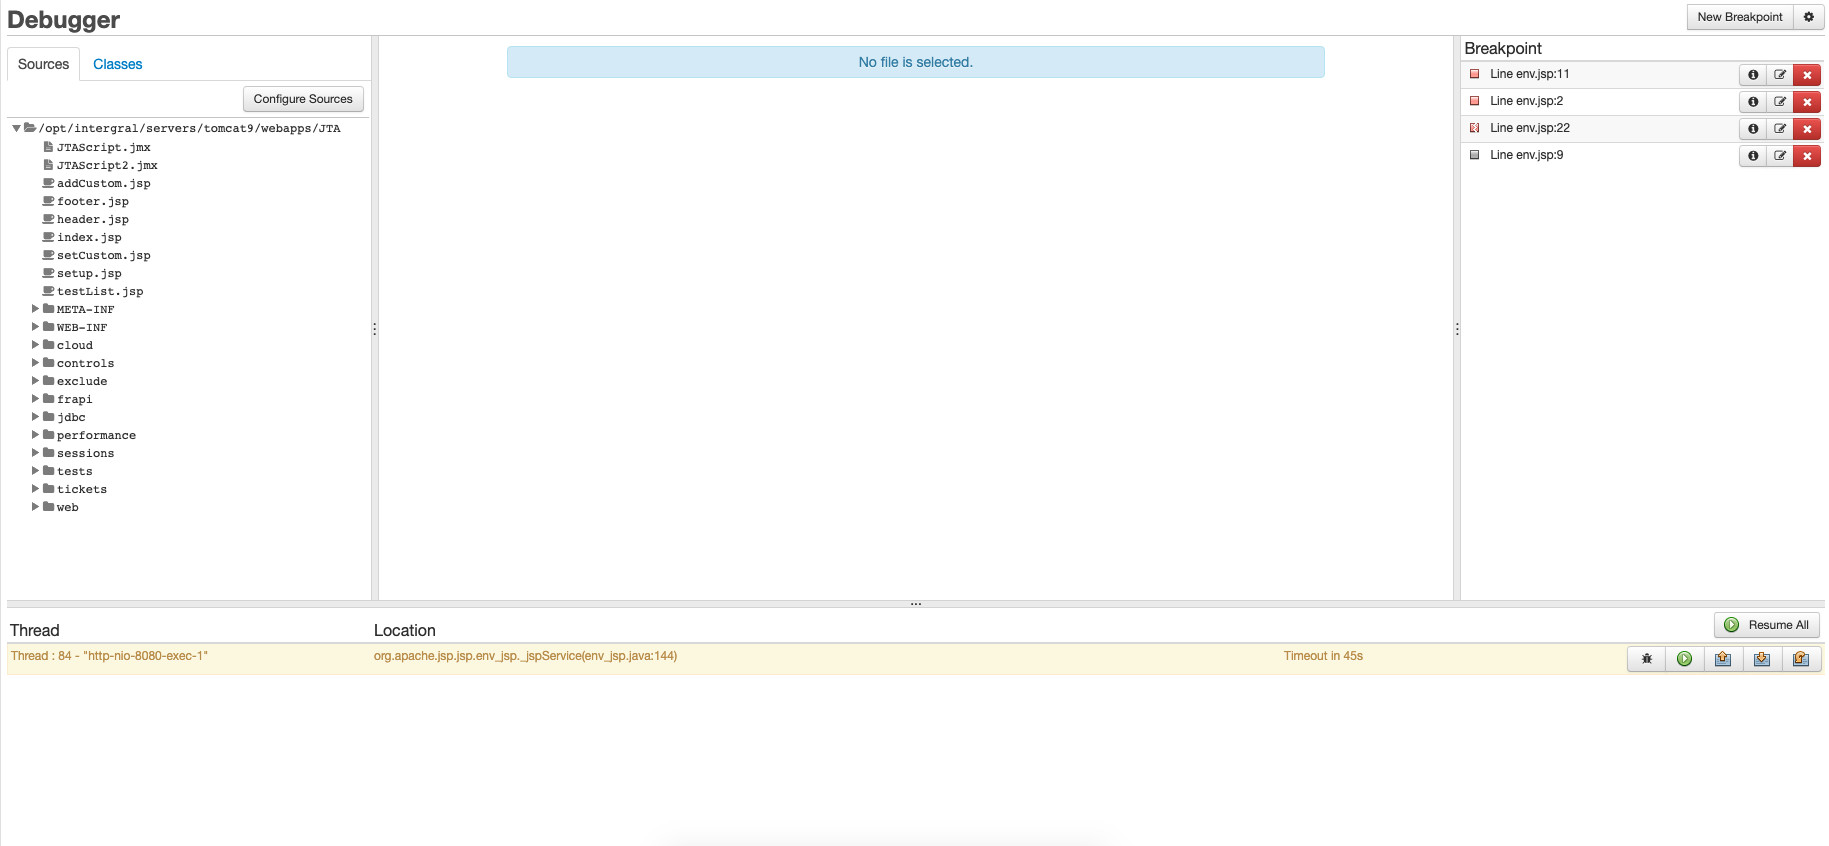
Paused Threads
Paused Threads
The Paused Threads section at the bottom of the page displays all threads currently paused in the debugger.

This table provides details about paused threads, including:
- Thread – The name or identifier of the thread.
- Location – The class, method, and line number where the thread is paused.
- Timeout – The time remaining before the thread resumes execution, unless it hits another interactive breakpoint (only shown if a timeout is configured).
Each thread has a dedicated row with control buttons, allowing you to view thread details or manage its execution.

The available controls for each paused thread, from left to right, are: .
The Debug button will take the user into the thread-specific view.
Info
Tip
The top toolbar includes a Resume All button, which is perfect for resuming multiple threads at once. For example, you can use this feature after removing a breakpoint to quickly resume all threads.
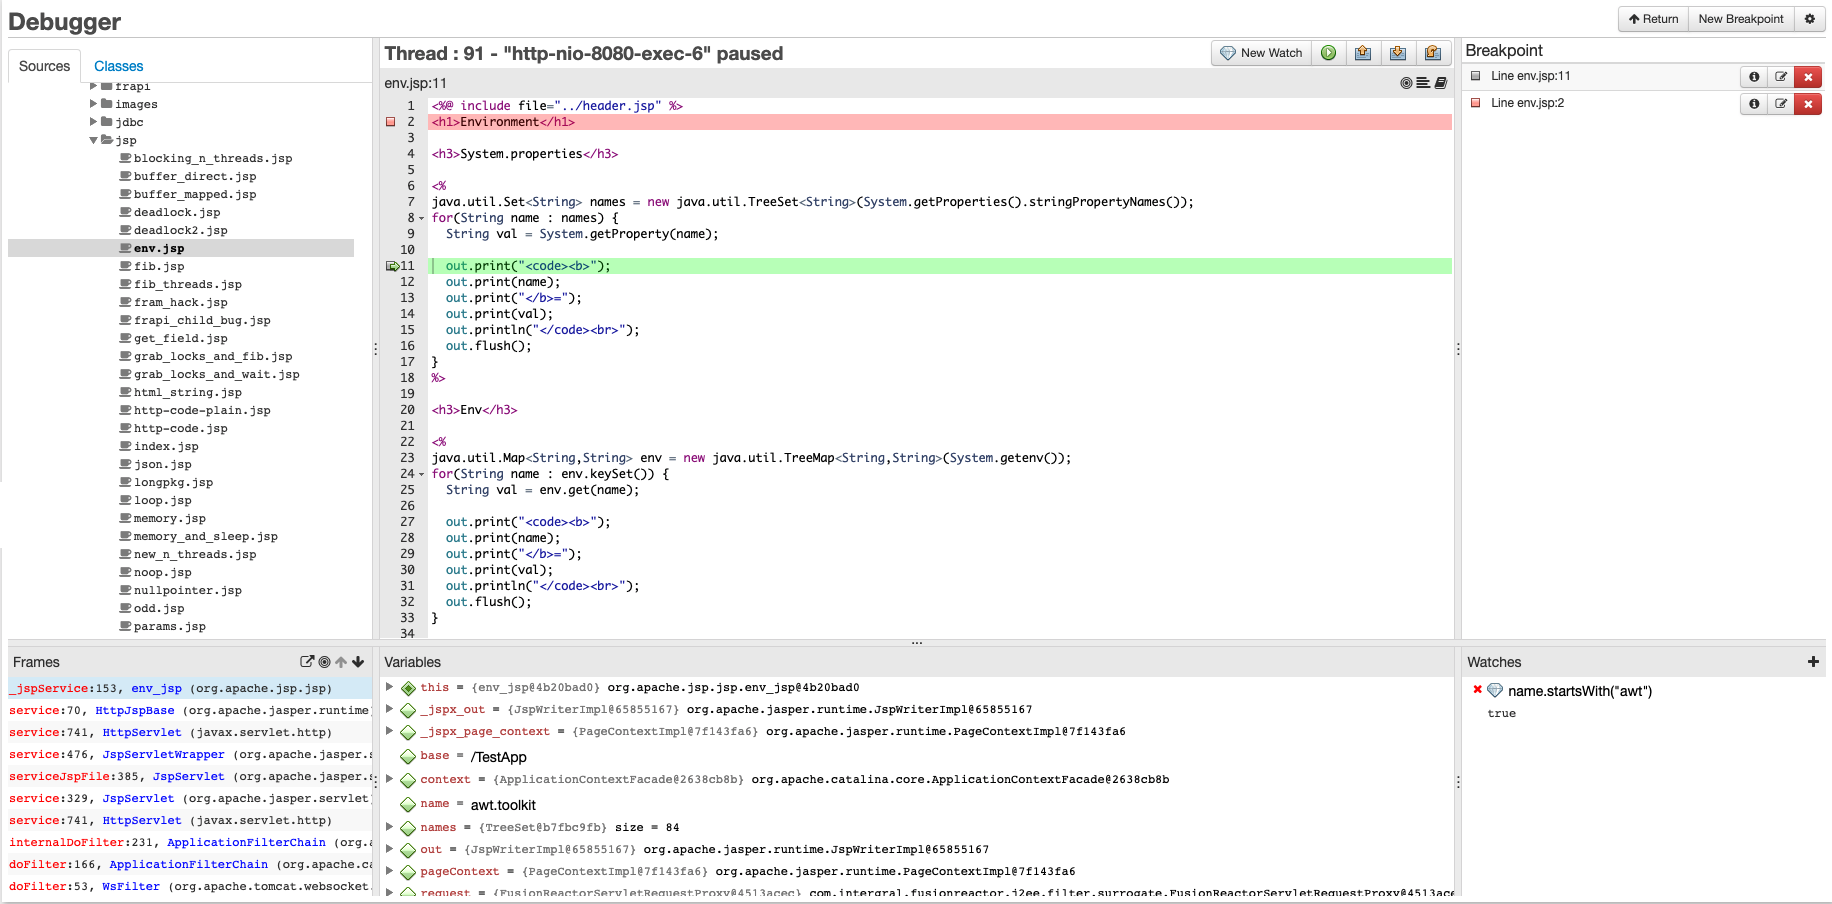
Viewing a paused thread
The Thread view shows the details of a specific thread once the thread has been paused in the interactive debugger.
This bottom part of the UI changes to show
- Stack Trace / Stack Frames (bottom left)
- Variable Viewer (bottom middle)
- Watches (bottom right)
In the top-right corner of the debug source code viewer, you'll find three buttons (from left to right):

- The first button scrolls the editor to the line where the thread is paused.
- The second button displays the stack trace for the paused thread.
- The third button shows transaction details for the paused thread (if available). This button may not always be present.
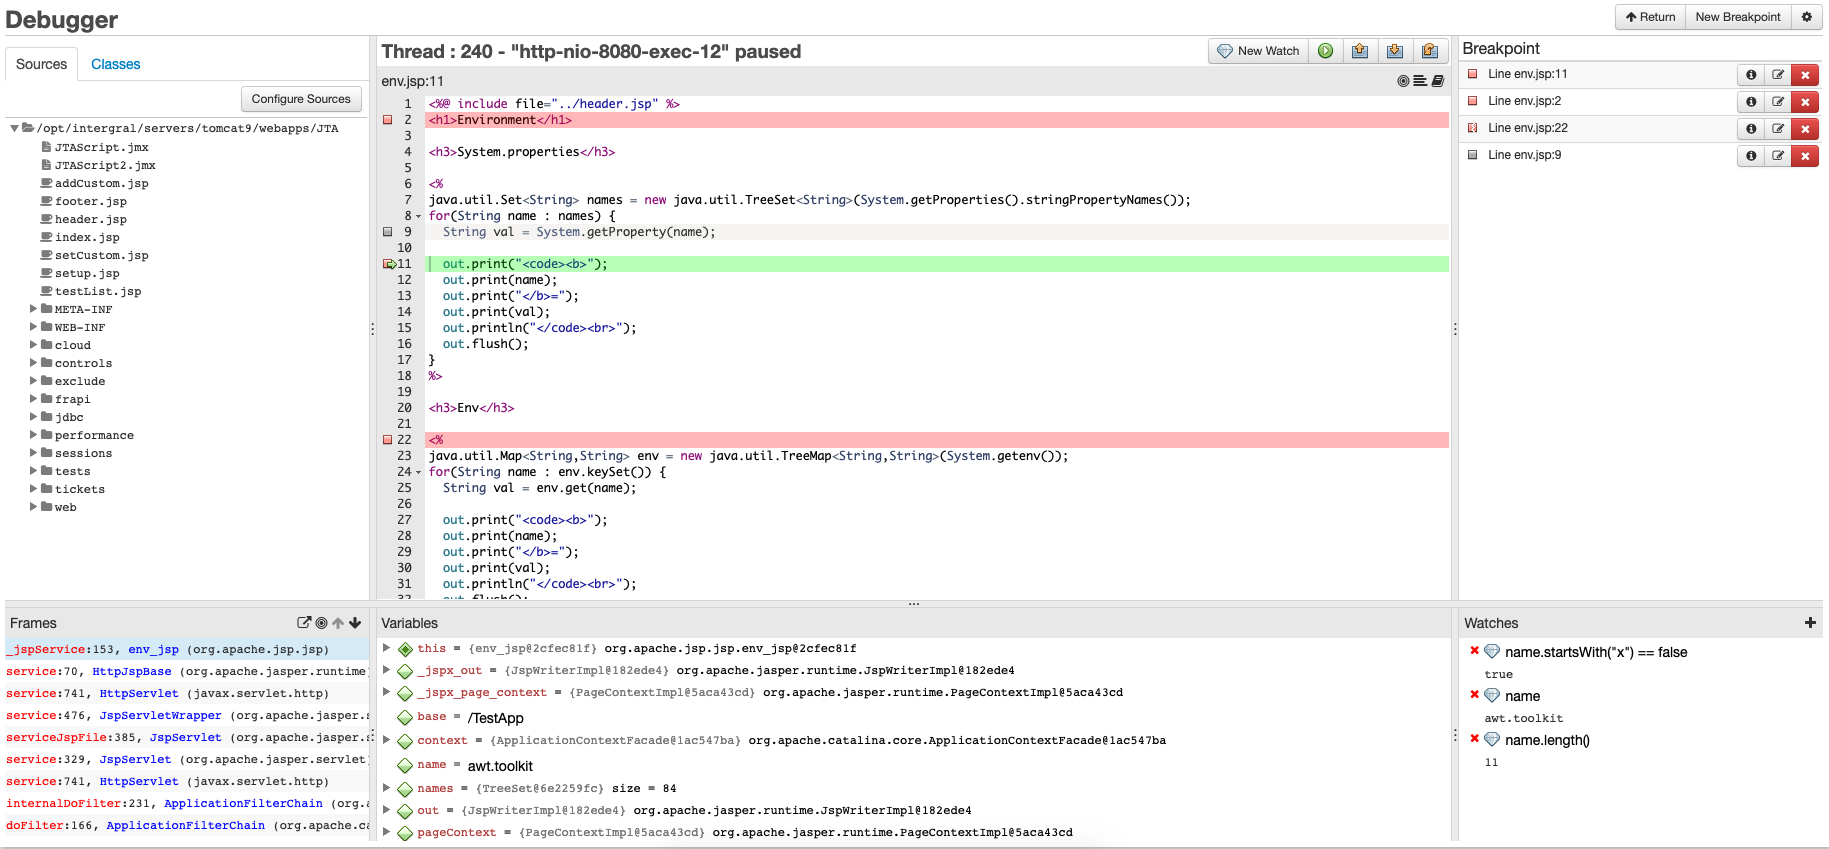
Source Code Viewer for a Paused Thread
The source code viewer displays the source code at the location where the interactive debugger is paused.
It uses the configured Sources to find and load the correct file into the interface. If no source file is found in the Sources, the viewer will display decompiled code instead. Decompiled code only shows line numbers for lines that correspond to known source lines. As a result, the left margin may have missing line numbers, especially for items like comments that aren't present in the class file.
The viewer supports syntax highlighting for Java, JSP, and CFML files.
Lines with configured breakpoints are highlighted in red, and a red square appears in the margin to indicate the breakpoint.

The line where the current thread is paused will be shows with a green arrow in the margin and a green highlighted line:

When both occur simultaneously, such as when the thread is paused at a breakpoint location, you'll see a green-highlighted line along with a combination of the green arrow and red box in the margin.

Disabled breakpoints in the source code appear as grey square.

When the breakpoint is disabled and the thread is paused on the line you'll see a green arrows with a grey square.

At the top of the viewer, you'll find the thread information, which displays details about the request running on this thread, along with other relevant thread data. This information corresponds to the thread details shown on the Stack Trace page in the Resource -> Threads section.
Stack Trace/Stack Frames
The Stack Trace view in the debugger shows the stack frames of the currently-paused thread.
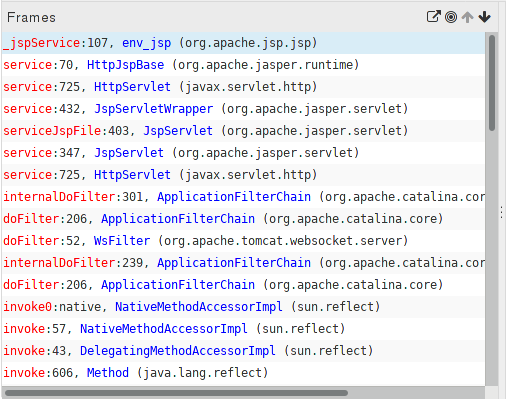
Clicking on any of the frames allows the user to select which stack frame they would like to view. When changing the stack frame, simply click on one of the grey arrows and the Thread View page loads the source and variables for that stack frame. The green arrow for the stack frame shows which stack frame you are currently viewing.
The icons on the top right of the Frames section of the UI are the following (left to right):
- Decompile the currently-selected frame

- Scroll the UI to show the currently-shown frame

- Go up a frame (from the current)

- Go down a frame (towards where the thread started)

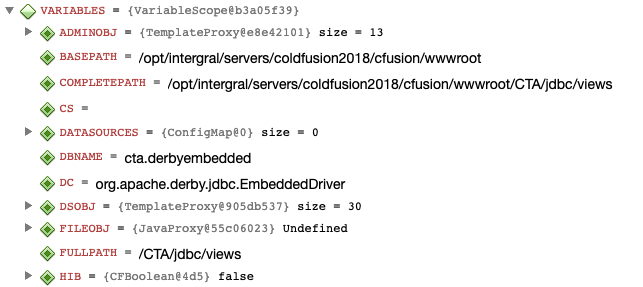
Variable viewer
The Variable viewer shows the variables currently available on the thread at the specific location that the interactive debugger has paused.
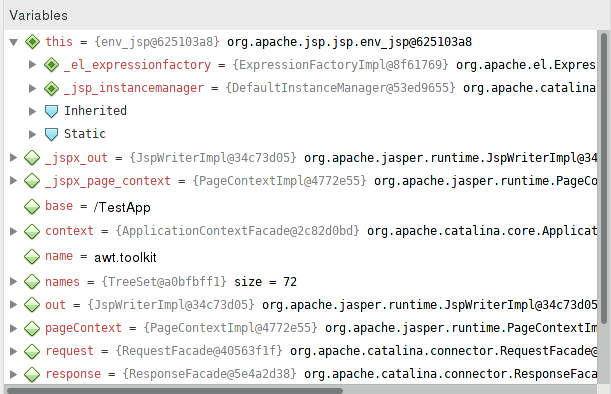
Variables are displayed in a tree structure, with the top-most nodes representing local variables within the function. For non-static method calls, a 'this' object will be shown (unless optimized away), representing the object on which the method is called.
- The variable name is highlighted in red.
- The class name and
Object.hashCode()appear in light gray. - The
toString()value of the variable is shown in black, on the far right.
Hovering over a variable will display the full class name in a tooltip.
You can expand object variables to view their fields, static variables, and inherited variables.
Fields or variables of primitive types (e.g., int, boolean) or java.lang.String can be modified in the variables tree on the right side. Hover over the value you want to change, and it will turn into an editable input field. Simply edit the value and press Enter to apply the change.
Watches
Watches can be set in the Debugger → Thread view once a thread is paused at a breakpoint (located at the bottom right of the FR page). Valid watches include Java or CFML expressions. The interactive debugger will attempt to evaluate these watches using the current variables and CF scopes at runtime.

Click the + to add a new watch, or press the red X to delete a watch. To modify a watch, simply click on the expression being evaluated. Watches are not deleted when the thread resumes; they will be re-evaluated the next time a breakpoint is hit.
Stepping
The interactive debugger allows the user to control the flow of the thread, allowing them to view the variables, source and stack as the thread progresses through the code.
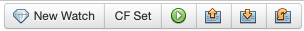
This is done via the controls at the top of the code viewer when viewing a paused thread.
Note
CF Set will only appear for CFC/CFM files (see CFML Set Variable).
Resume
When you click the Resume button, the thread will continue from its current location and run until it reaches the next interactive breakpoint.
In the thread view, pressing the button will display a message indicating whether the thread is now running or terminated. If the thread hits another breakpoint within 1 second, the thread view will reappear for that thread.
Step Out
Clicking the Step Out button causes the thread to continue executing until it exits the current method. Once the method returns, the thread will pause in the interactive debugger. If this takes longer than 1 second or if the thread is terminated, a message will notify the user.
Step In
Clicking the Step In button allows the thread to execute until it hits the next line in the current method or steps into a new method. The thread will then pause in the interactive debugger. If this takes longer than 1 second or if the thread is terminated, a message will notify the user.
Step Over
Clicking the Step Over button causes the thread to execute until it reaches the next line in the current method or until the method returns. The thread will then pause in the interactive debugger. If this takes longer than 1 second or if the thread is terminated, a message will notify the user.
CFML Scopes
When the thread is paused inside a CFML-specific file (CFC or CFM), the Variables View will display CFML scopes. These function similarly to local variables, but are sourced from the scope locations available at the point where the thread is paused.
CFML Set Variable
When the thread is paused inside a CFML-specific file (CFC or CFM), the top toolbar will display a new button labeled "CF Set." This button allows you to set a variable in the CFML scopes by entering a variable name and value.
To use it, type the variable name in the Variable field, enter the expression in the Expression field, and then click the Set button to apply the changes.
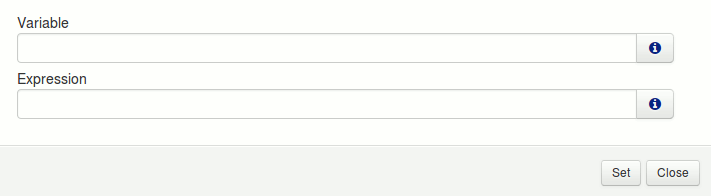
Variable
Example
VARIABLES.i
Expression
Example
VARIABLES.i + 10
Sampler Graphs
The sampler graphs page of the debugger allows the user to see how often a breakpoint is being hit.
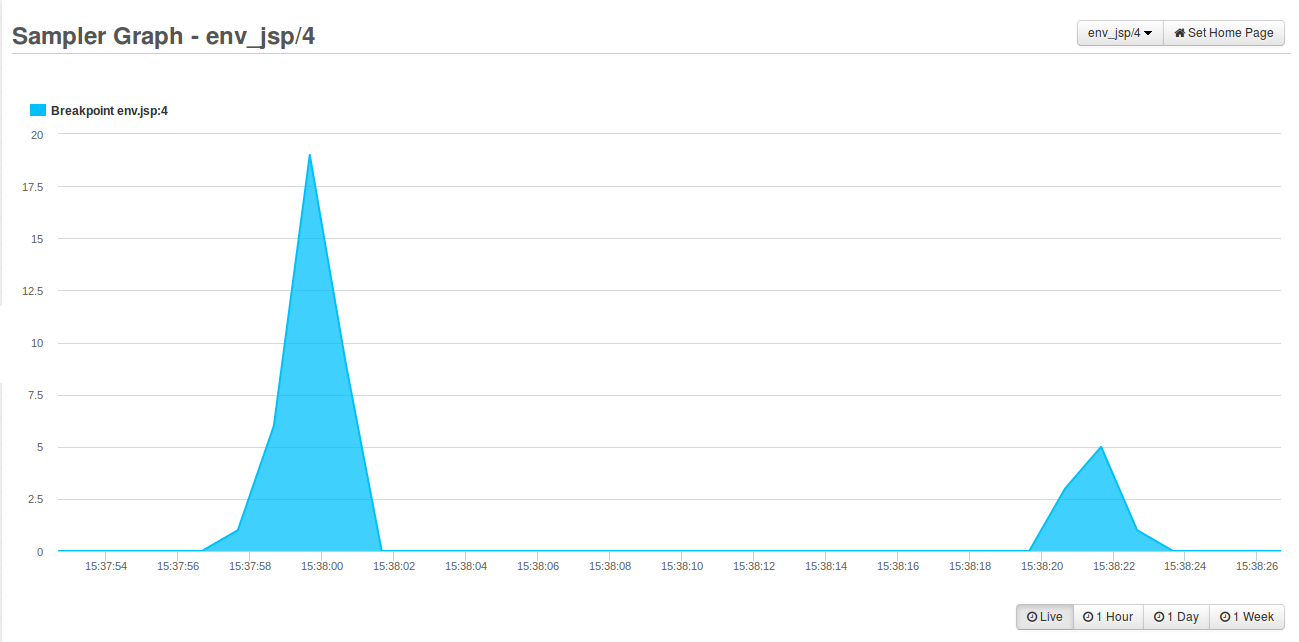
In the top right of the page the user can select which specific breakpoint sampler series to view.
Examples
The Production Debugger in FusionReactor is very powerful and can be daunting when you first start to use it.
We have prepared some examples, which include the code, breakpoints and results, to aid your introduction to the debugger.
- Debug Example: Setting a conditional breakpoint in ColdFusion loop
- Debug Example: Setting an automatic breakpoint following a ColdFusion Exception throw
- Debug Example: Setting an email alert on first occurrence of an exception
- Debug Example: Setting conditional breakpoint in catch block
- Debug Example: Filter on a specific IP Address in JSP/Servlet requests
Manual installation
The debugger relies on a native library. If FusionReactor is not installed by FRAM, the Manual Debug Installation instructions must be followed to enable the Production Debugger.
Known issues and limitations
Info
The Production Debugger is only available on 64 bit operating systems
Database table lock escalation
With some databases (especially Microsoft SQL Server) it's possible for a single thread to lock a database table completely until the transaction is committed.
If you set the maximum paused threads in the debugger to be 1, it's still possible that this 1 paused thread can stop all others from functioning.
This will occur if you do the following:
- Start a transaction.
- Perform some SQL which escalates to a full table lock in the DB.
- Set a breakpoint in code which is before the commit occurs.
Step 2 locks the database table, but it's never committed. The debugger then pauses this thread in the debugger and as a result, the duration of the table lock will be a lot longer and that causes all other threads which need to acquire this table to lock to pause too.
Double submits and replay attacks
When using the Debugger it is good to ensure that the website being debugged can cope with multiple submits from the same form.
If you have the following case:
- User A submits a form to the website.
- The Debugger pauses the thread in the interactive debugger with a 5 minute timeout.
- User A sits there waiting and gives up. They press submit again.
- This request goes through (maybe due to Fire Count or Max Thread setting not allowing it to be paused).
- After 5 minutes the initial submit from step 1 goes through.
- Unless the DB or the server logic can cope with this the customer may end up purchasing 2 of the items.
GLIBC 2.14
For debugger to work it uses a native library to provide some of the debug features.
This native library relies on GLIBC version 2.14 library.
Tech note : FRS-355
provides a version of this libc.so.6 and instructions on how to use it just for
the debugger.
Rate limiting ordering
The production debugger has 3 different rate limit options.
- Breakpoint -> Fire Count - how many times a breakpoint should fire before becoming disabled.
- Settings -> Email Alert Interval - the delay between emails being sent where emails simply don't get sent.
- Settings -> Max Threads - the maximum number of threads which can be paused in the interactive debugger. If this is hit all new breakpoints simply continue and never stop in the debug engine.
Fire count with emails
When using the breakpoint fire count limit and the email alert interval, it's important to understand that the fire count acts as a precondition.
In other words, the code executes the breakpoint in the following sequence:
- Check if the breakpoint fire count limit has been hit. If not continue to step 2 and increase the counter
- Check if the email alert interval allows emails to be sent.
- Send email or silently ignore alert due to settings in #2.
This means that the precondition of the fire count will increase even though the email alert interval vetoes the email being sent.
Fire count with max threads.
When using the breakpoint fire count limit and an interactive breakpoint with the max threads settings the fire count is a precondition.
In other words, the code executes the breakpoint in the following steps.
- Check if the breakpoints fire count limit has been hit. iI not continue to step 2 and increase the counter
- Check if the max threads settings allows this thread to be paused.
- Either pause the thread in the interactive debugger or veto the pause event and continue the threads execution.
This means that the precondition of the fire count will increase even though the max thread setting vetoes the thread being paused.
Performance Impact
Exception Support
When enabling the exception breakpoint capability, it causes the JVM to activate a special mode. Although generally, no performance impact will be felt with this mode, it can cause some operations to become slow. Also, this setting is known to heavily affect the compilation time of large files on ColdFusion and operations which throw a lot of exceptions (like javacc-based parsers).
If you enable this, it is recommend that you also enable the Save Classes feature on ColdFusion servers to avoid recompilation. The "Save Classes" feature can be found in the ColdFusion admin console under the Server Settings > Caching.
Exception Support can be enabled by configuring the following system property in the JVM arguments file:
Info
Event snapshots can be triggered when exceptions occur. However, event snapshot generation will not be triggered by exceptions or errors unless exception support is enabled.
Stepping mode
By default, the Production Debugger runs in "Low-impact stepping mode". This stepping mode ensures that the JVM runs as quick as possible but also means that stepping operations like Step-Out and Step-Over may take longer.
You can enable the "Fast stepping mode" by configuring the following system property in the JVM arguments file:
When "Fast Stepping Mode" is enabled, stepping operations are executed as quickly as possible. However, be aware that this may negatively impact the JVM's performance.
While there is generally no noticeable performance impact with "Fast Stepping Mode" enabled, it can cause certain operations to slow down.
Warning
This setting is known to significantly affect the compilation time of large files in ColdFusion and operations that throw many exceptions (such as javacc-based parsers). If you enable this mode, it is recommended to also enable the "Save Classes" feature on ColdFusion servers to prevent unnecessary recompilation.