Databases
The Databases page shows an overview of the statistics gathered by FusionReactor, related to database connections.
Page controls
There are a number of controls on the top of the page that allow for filtering of the data.
| Control | Description |
|---|---|
| Database Control | This control allows you to select the database you want to view. |
| Time Frame | This control allows you to select different time frames to view. |
| Clear History | This control allows you to delete all data for the currently selected database. |
| Set Home Page | This control allows you to set this as the home page for the currently logged in user. |
| Refresh Control | This control allows you to set the auto refresh interval for this page. |
| Refresh Button | This control allows you to immediately refresh the page. |
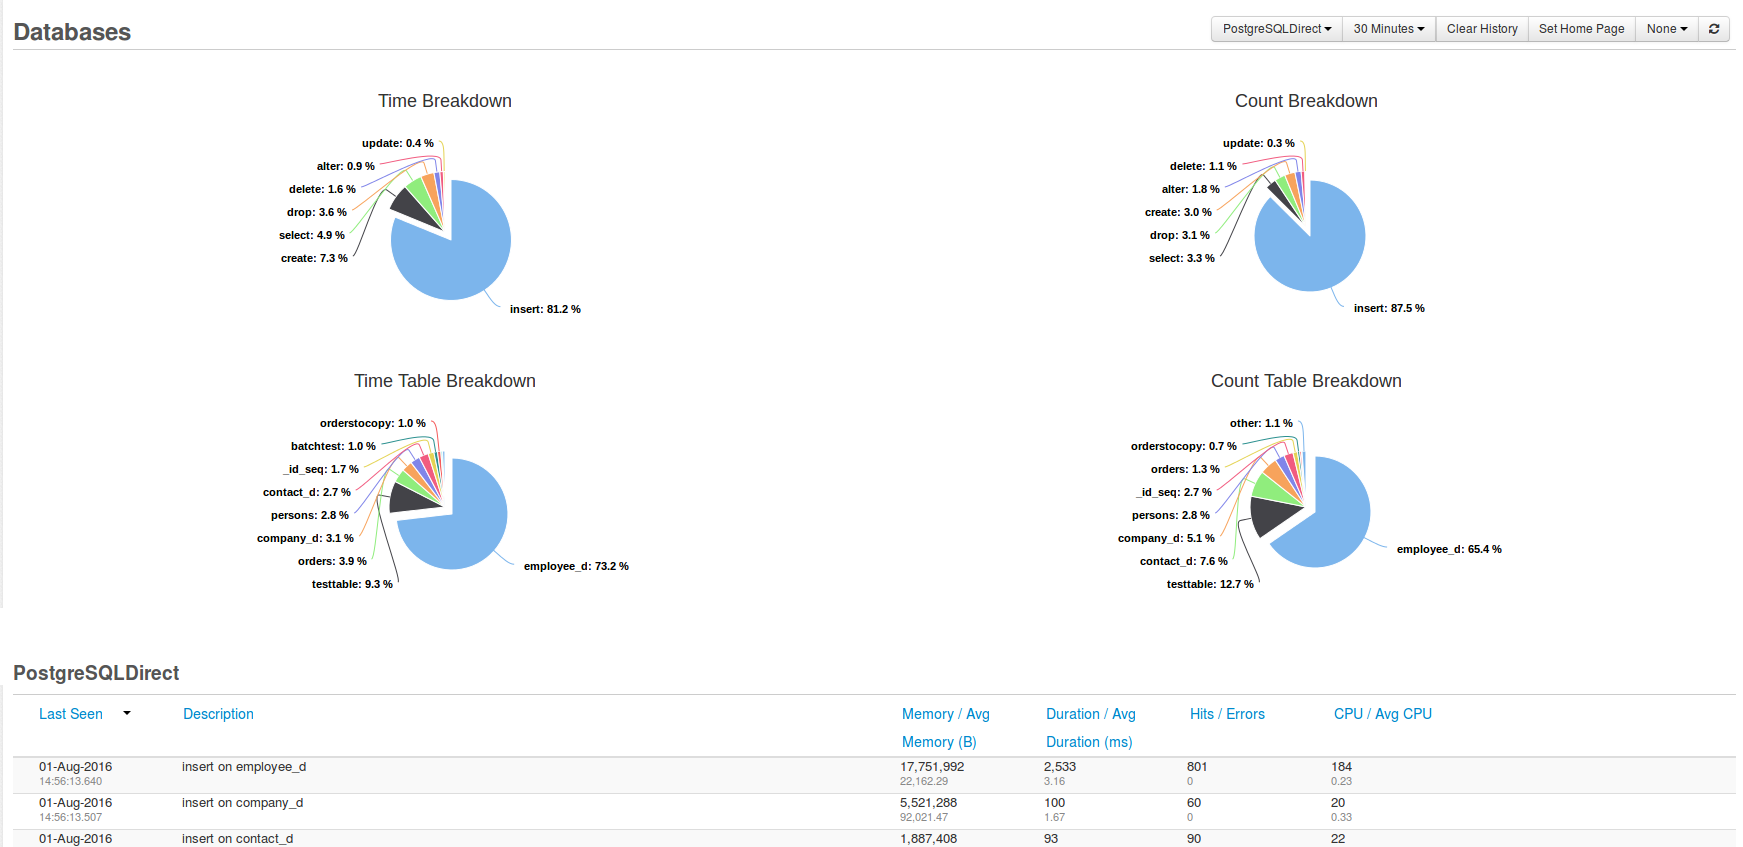
Pie charts
On this page there are four pie charts displaying the data for the selected database and time frame.
Info
All these charts are limited to displaying 9 entries with the 10th becoming an aggregation of the remainder and being called other.
| Pie chart | Description |
|---|---|
| Time Breakdown | Shows the time that was spent in each operation method (select,insert, find, findAndModfiy). |
| Time Table Breakdown | Displays the time spent on each table in the database. |
| Count Breakdown | Shows the number of requests on each operation method (select,insert, find, findAndModfiy). |
| Count Table Breakdown | Displays the number of requests on each table in the database. |
Table
The table displays the aggregated data in a more detailed view, based on the time frame.
| Column | Description |
|---|---|
| Last Seen | Time at which FusionReactor last saw a request that matched this hit. For example, the same method to the same transaction type. |
| Description | Description of the hit. |
| Memory / Avg Memory (B) | Total allocated bytes for this hit, and the average allocated memory per hit. |
| Duration / Avg Duration (ms) | Total time spent on this hit, and the average duration per hit. |
| Hits / Errors | Total number of hits seen and the number of those hits that reported an error. |
| CPU / Avg CPU | Total time spent on the CPU for this hit and the average type spent on the CPU for each hit. |
Need more help?
Contact support in the chat bubble and let us know how we can assist.