Overview
FusionReactor 7 introduces enhanced memory analysis capabilities, allowing users to see which objects are consuming the most memory on the application server. It displays live objects on the heap and traces their GC paths (garbage collection paths) back to the GC Roots, showing why these objects are still retained in memory.
The View Heap feature provides a real-time view of current objects in the heap. From the Live Heap View UI, users can navigate to the GC Roots page to understand why specific objects remain live.
The Snapshots page enables users to take heap snapshots, which can then be compared (diffed) against earlier or later snapshots to identify memory changes over time.
View Heap
FusionReactor provides detailed visibility into the various memory spaces available in your Java engine. While the memory heap space gives an overview of memory usage, it’s not precise enough to reliably detect memory leaks. Identifying leaks can be challenging, but FusionReactor’s in-depth profiling capabilities make it much easier.
If you’re using FusionReactor Ultimate, Developer Edition, or the free trial, you’ll have access to the Heap Histogram, available under the Memory tab.
The View Heap page provides a detailed profile of the Java Heap. This is particularly useful for spotting issues such as large numbers of objects being created in a specific class or potential memory leaks. You can configure the refresh rate to capture heap snapshots as frequently as every second. By default, the view prioritizes objects that consume the most memory.
Adjusting the refresh rate (top-right of the screen) allows you to watch heap utilization fluctuate as your application runs, showing classes and their associated objects growing and shrinking in real time.
The key is to observe deltas in object counts and memory usage during specific application procedures. If objects are properly released after a procedure, memory usage should return to normal. Any discrepancies can help highlight potential memory anomalies.
Basic Process
To achieve the best results when capturing deltas and analyzing memory, follow these steps:
- Force a Garbage Collection (GC): Click the Force GC button at the top of the page to clean up unused objects.
- Take an initial heap snapshot: Click the New Snapshot button to capture the current state of the heap.
- Run your application procedure: Execute the procedure you want to analyze, one or more times as needed.
- Refresh the heap histogram: Click the Refresh icon to reload and update the heap view.
- Take a second heap snapshot: Click New Snapshot again to capture the heap state after your procedure has run.
This process allows you to compare snapshots and identify memory changes or potential leaks.
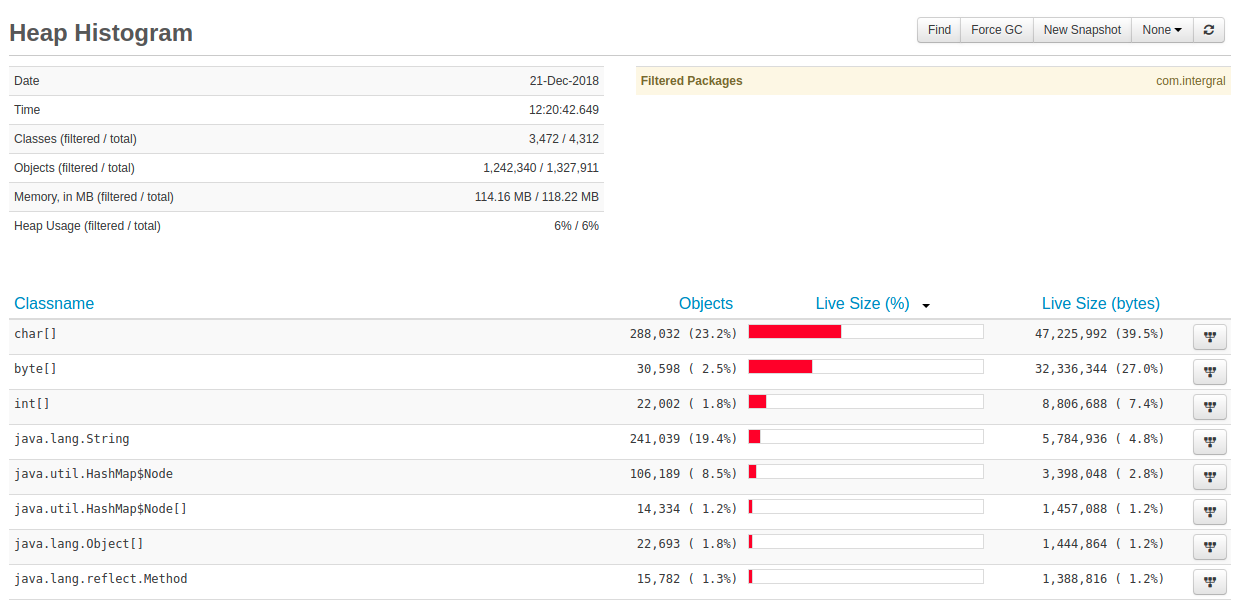
Heap Histogram Page
The Heap Histogram page provides a detailed view of memory usage and object allocation:
- Top Left: Displays information about the time the page was generated, the number of classes and objects scanned, and whether any items have been hidden due to filters.
- Top Right: Includes tools to search/find specific class names or substrings. You can also Force a Garbage Collection (Force GC) or trigger a new snapshot. (See Snapshots for more details.)
- Lower Section: Shows a table of unique classes, including the number of live objects and the memory they occupy on the heap. You can sort the table by any column. Each row also includes a button to view the Garbage Collection (GC) Roots for that class. Clicking this button lets FusionReactor identify what is keeping those objects live. (See Garbage Collection Roots for more information.)
Filtering
The Heap Histogram page allows you to filter specific Java packages. By default, FusionReactor excludes its own code (com.integral).
You can configure filtering via Memory Settings to hide packages you know are safe, reducing the table to show only your application or framework code.
When package filtering is applied, the table in the top left of the page updates to show the total number of objects and classes found versus the number currently displayed after the filter is applied.
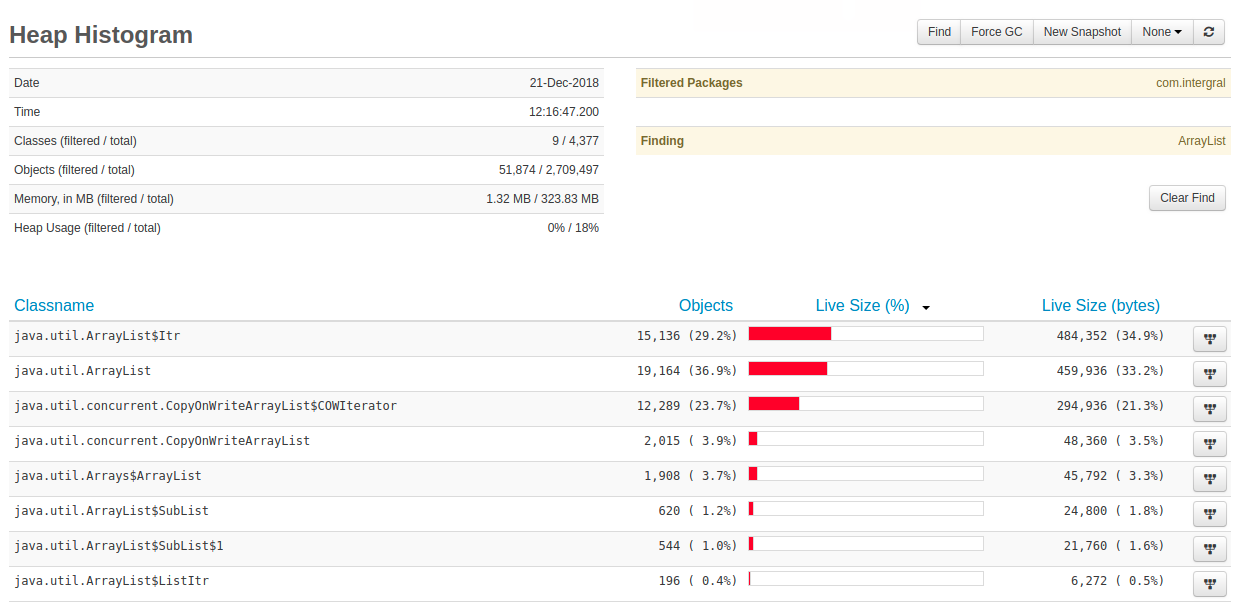
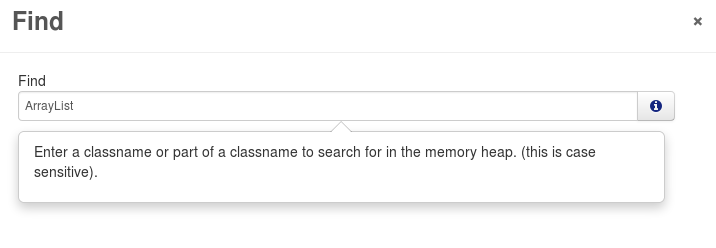
Find
The Find feature allows you to search for a specific string or substring within class names.
For example, pressing the Find button and entering ArrayList will filter the Heap Histogram page to display only classes containing the string ArrayList:
After pressing Confirm, the UI updates to show the filtered results. To remove the filter and return to the full view, simply press the Clear Find button.
Garbage Collection Roots
In the Heap View of the live Java heap in FusionReactor, you can press the GC Roots button (far right of the UI) to see why a specific object is being kept “live” and not garbage collected.
For example, if the page shows char[], it might indicate that there are 171,778 char[] objects on the heap, consuming 21,880,994 bytes of memory. In this case, most of the char[] objects are retained by java.lang.String, which accounts for 83.1% of all char[] on the heap.
The screenshot below illustrates how java.util.HashMap$Entry objects with a key field can indirectly retain 23.2% of char[] objects. The key field references a java.lang.String, whose value field is ultimately keeping the char[] alive.
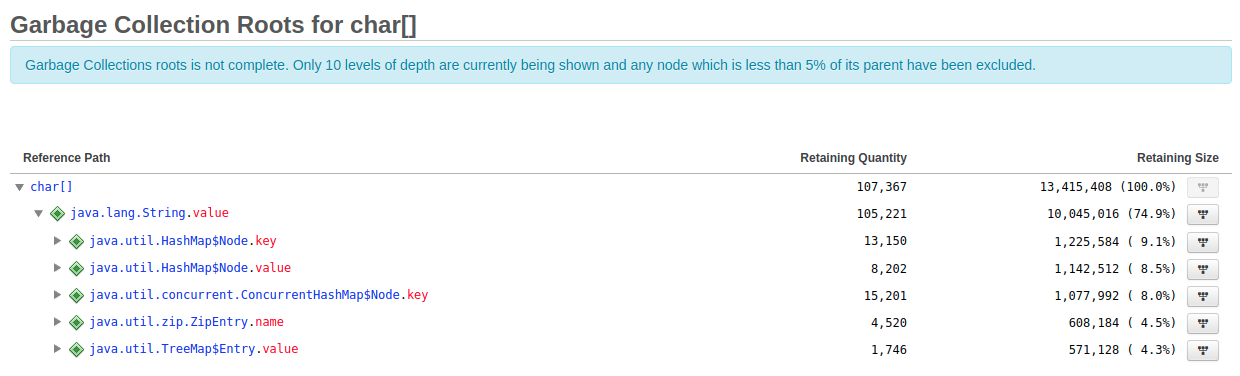
You can expand each node to navigate the GC root path and trace exactly what is keeping objects live.
GC Roots Types
| FusionReactor Label | JVMTI Constant | Description |
|---|---|---|
| JNI Global | JVMTI_HEAP_REFERENCE_JNI_GLOBAL | JNI global reference |
| System Class | JVMTI_HEAP_REFERENCE_SYSTEM_CLASS | System class |
| Monitor | JVMTI_HEAP_REFERENCE_MONITOR | Monitor |
| Stack Local | JVMTI_HEAP_REFERENCE_STACK_LOCAL | Local variable on the stack |
| JNI Local | JVMTI_HEAP_REFERENCE_JNI_LOCAL | JNI local reference |
| Thread | JVMTI_HEAP_REFERENCE_THREAD | Thread |
| Other | JVMTI_HEAP_REFERENCE_OTHER | Other heap root reference |
For more details, see JVMTI Heap Reference Kind Documentation.
Key UI Elements
- Reference Path to GC Root: Shows the chain of classes and fields referencing the selected object (e.g.,
char[]). Navigating deeper reveals the specific GC Roots keeping objects alive. - Retaining Quantity: Number of objects the reference is keeping live.
- Retaining Size: Memory size of the objects the reference is retaining.
Heap Snapshots
Heap Snapshots
The Heap Snapshot page functions similarly to the live heap view but captures the heap state at a specific point in time and stores it on disk.
When you first open the page, it will be empty. Press New Snapshot to capture a snapshot. Once generated, it appears in the snapshots table:
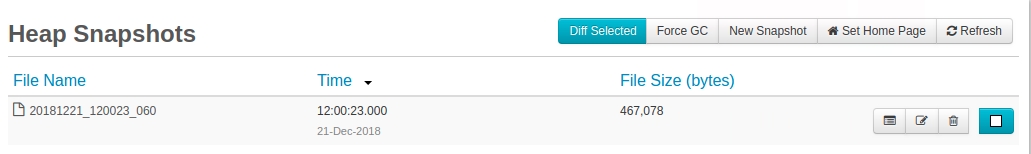
From the snapshots table, you can:
- View a snapshot: Press the
 button.
 - Rename a snapshot: Press the
 button. The name is also the filename on disk, usually stored in
 <instance>/heap. - Delete a snapshot: Press the
 button.
Viewing a Snapshot
The UI for viewing a heap snapshot is the same as the Heap View page.
- You can filter packages to focus on relevant code.
- Use the Find functionality to locate specific class names or sets of classes.
Diff
Once you have more than one snapshot, you can compare them using the Diff feature.
- Select the blue checkboxes for the two snapshots you want to compare.
- Press Diff Selected at the top of the snapshots page.
The Diff page displays a left and right snapshot, highlighting the delta between them. You can use the Reverse Diff button (top right) to swap the order of the snapshots.
The top two tables provide detailed information about each individual snapshot, similar to the Live Heap and Heap Snapshot views. The package filter and Find features are fully supported on the Diff page, allowing you to focus on specific classes or packages.
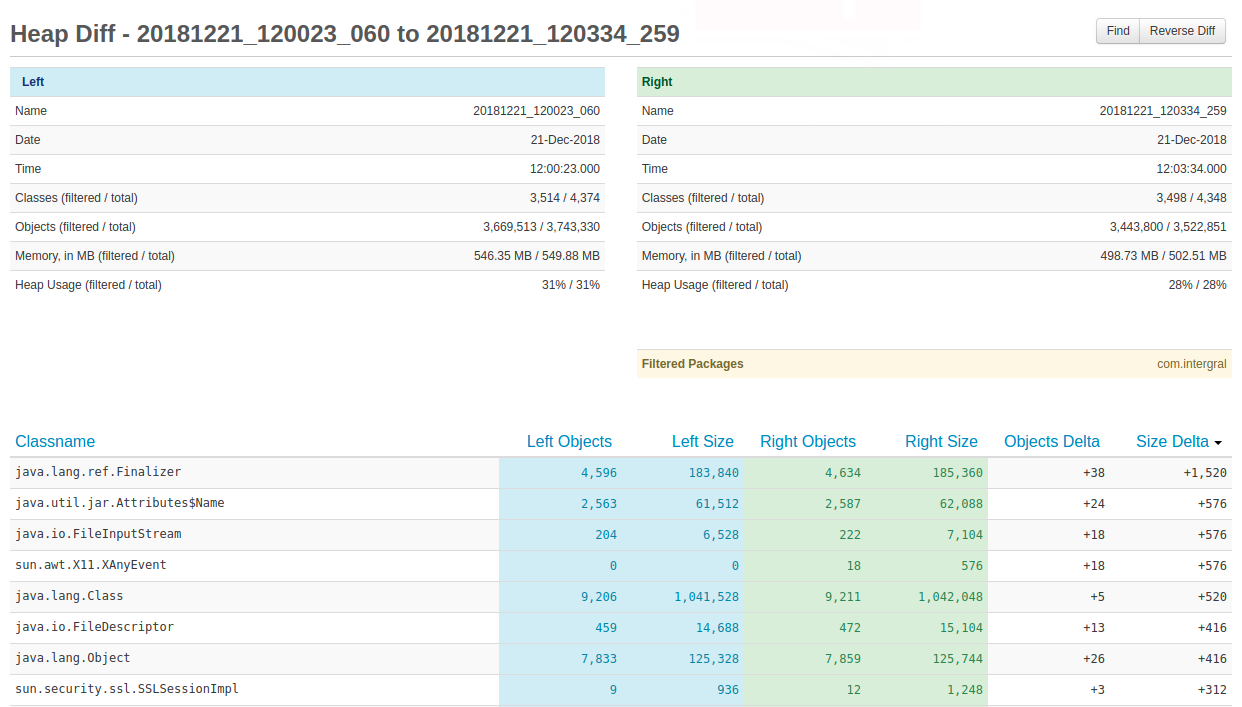
The lower part of the Diff page shows the actual comparison between the snapshots.
- Left and Right Snapshots: Columns are color-coded (blue for left, green for right) and display the number of objects and memory size for each class.
-
Diff Columns:
-
Objects Delta: Shows the difference in object count between the right and left snapshots.
- Size Delta: Shows the difference in memory usage for each class between the right and left snapshots.
By default, the table is sorted by Size Delta, so the top line represents the class that is consuming the most additional memory in the right snapshot compared to the left.