Archive metrics
🔎Find it: Logging → Archive Viewer or Metrics → Archived Metrics.
FusionReactor captures the instrumentation metrics to process into a number of defined log files. The log Archive Viewer is used to visualize the log archives which are generated by FusionReactor.
FusionReactor captures instrumentation metrics and processes them into a number of defined log files. The Archive Viewer allows you to visualize these log archives directly within the UI.
Learn more
User interface
Time frame
The date and time picker controls allow you to navigate through log archives and visualize file contents for specific points in time.
Info
When accessed through the menu, the default selection is set to today, and the most recent archive file will be displayed.
Date picker
- Use the left/right buttons to move backward or forward by one day.
- Click the date input to open the calendar view (shown above).
Time picker
The time picker displays the available rotations for the selected date. Two values are shown:
-
First value: The time of the first log entry in that rotation.
-
Second value: The time of the last log entry in that rotation.
-
Use the left/right buttons to move through rotations.
-
Click the time input to view all stored log files for the selected day.
Note
The Archive Viewer determines the display date based on the log’s start time, while the Log Archive page uses the rotation date.
Log Files
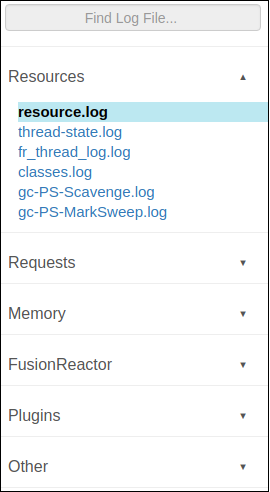
The file picker allows you to navigate between different log files in the archive. Log files are grouped into logical categories, such as:
- Resources
- Request
- Memory
A search box is available at the top of the file section. When you search for a log file, the corresponding category will automatically expand (if the file exists for the selected rotation).
Info
Only log files that exist for the chosen time frame will appear in the file section.
Platform-specific categories
Some log files are platform-specific and not generated directly by FusionReactor. These are grouped under either:
- Other
- ColdFusion (if FusionReactor is running on ColdFusion)
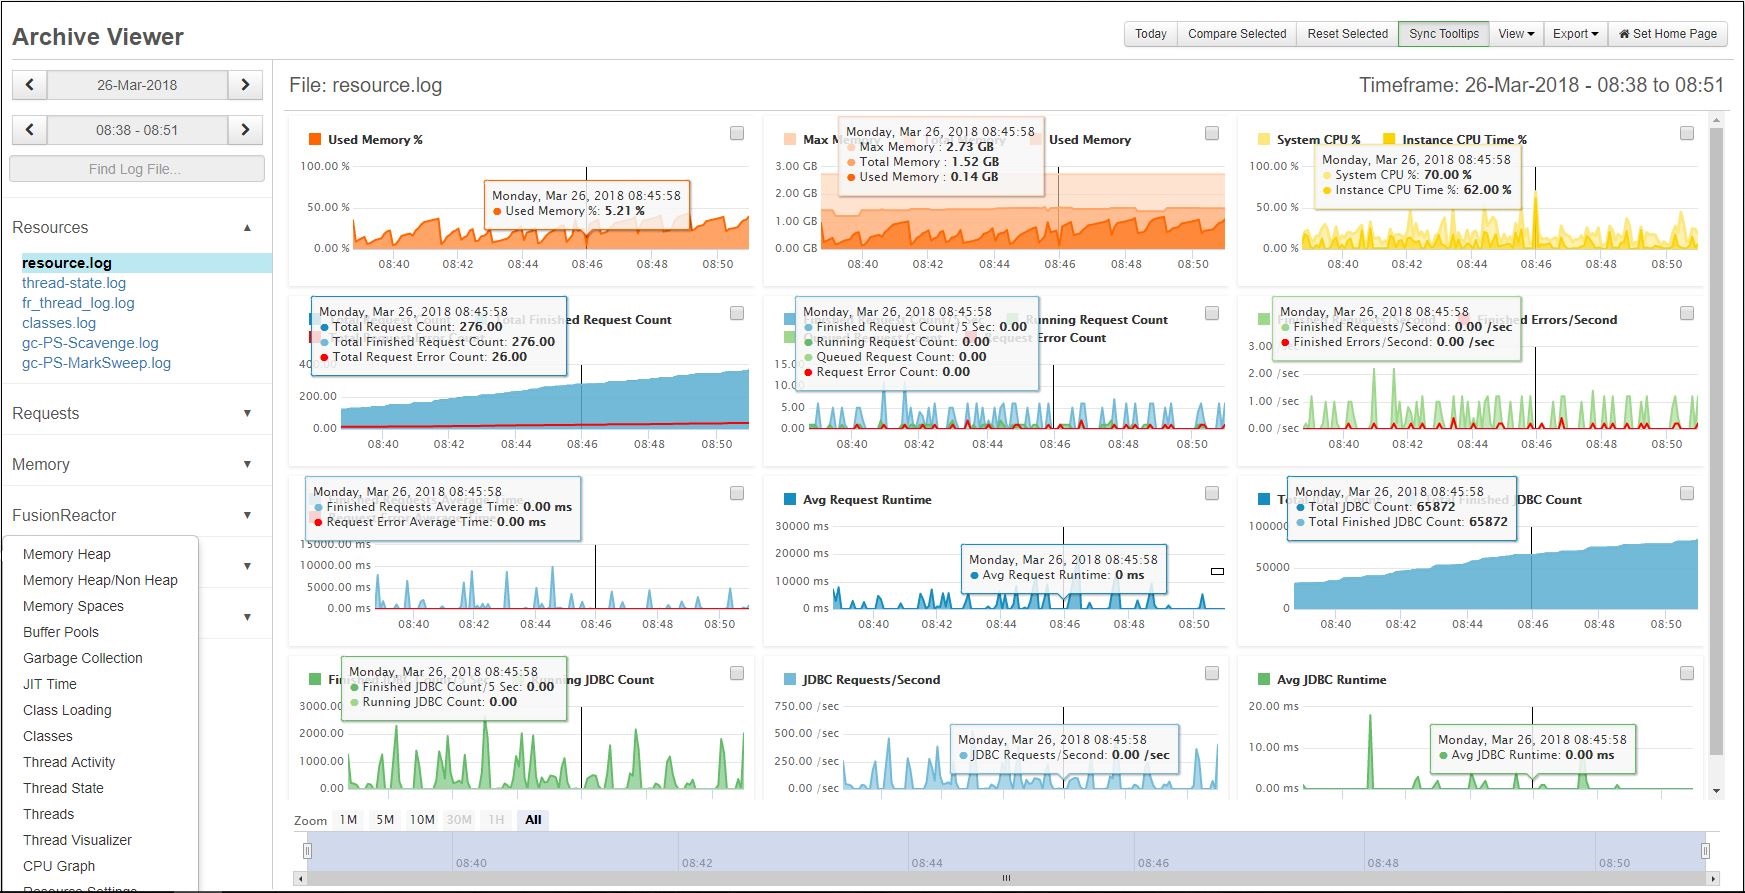
Dashboard
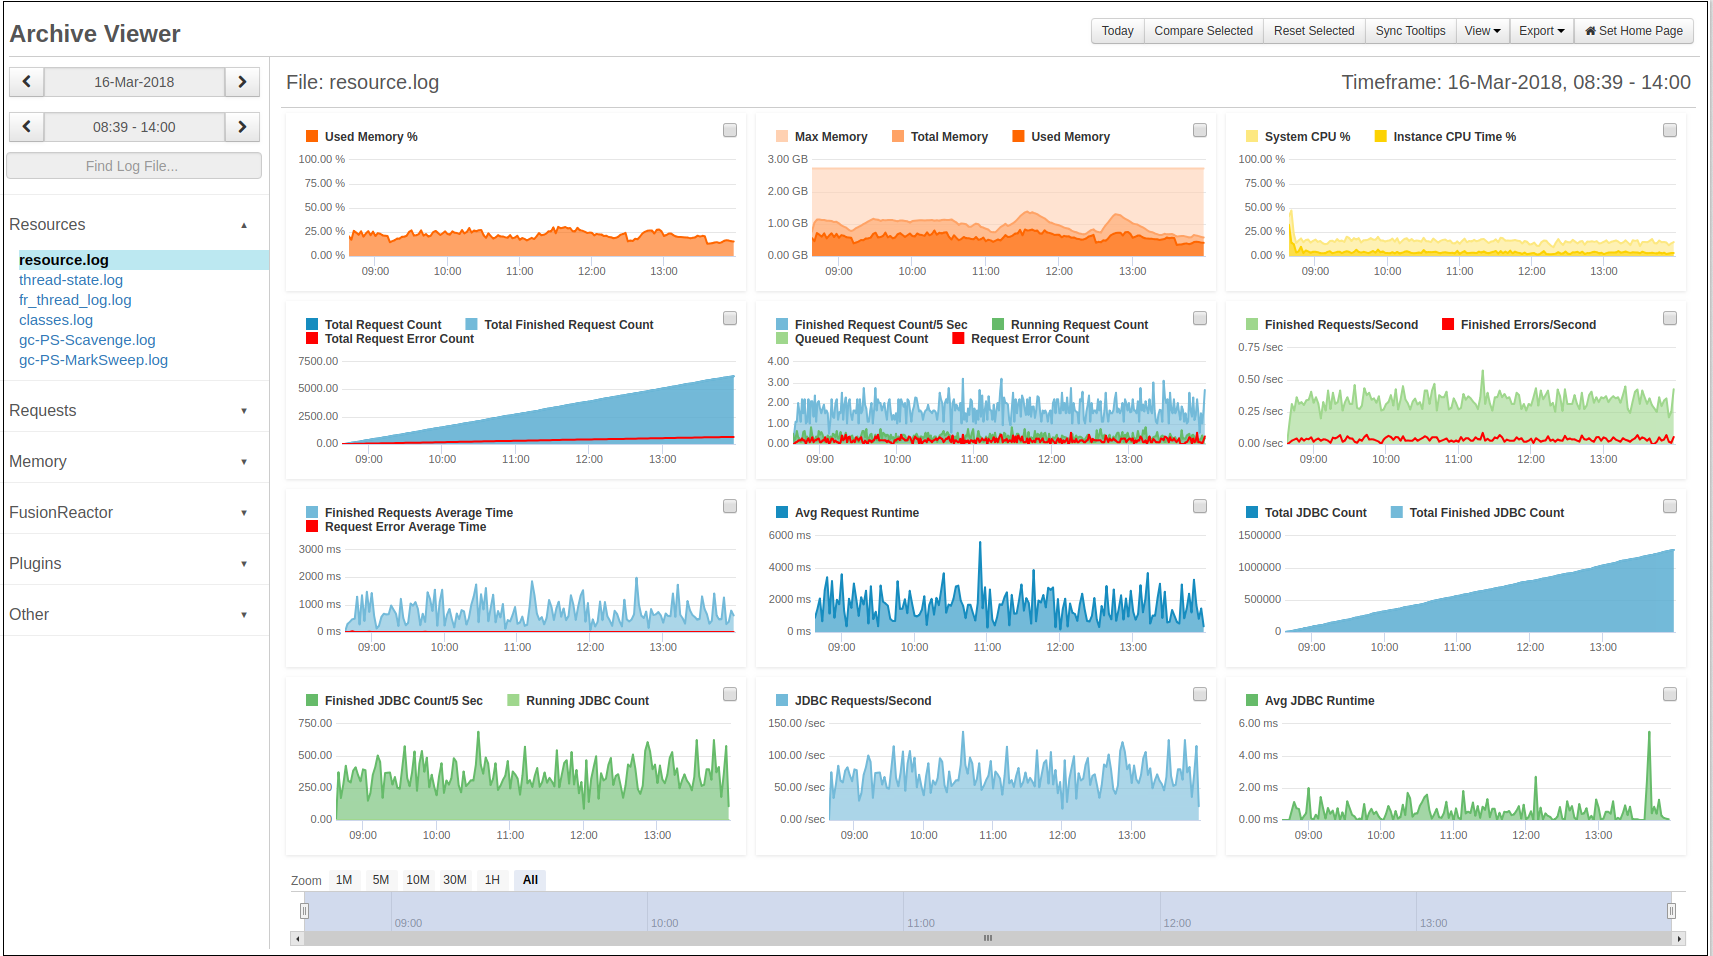
When you select a log file (e.g., resource.log as shown above), the metrics it contains are displayed in a Dashboard view by default.
- The number of graphs shown depends on the number of metrics stored in that log file.
- You can select and compare individual metrics within a single view to gain deeper insights.
Tip
To compare graphs, check the boxes beside the graphs you want to review, then click Compare Selected.
The dashboard can be reset to its original view at any time by clicking Reset Selected.
Spreadsheet View
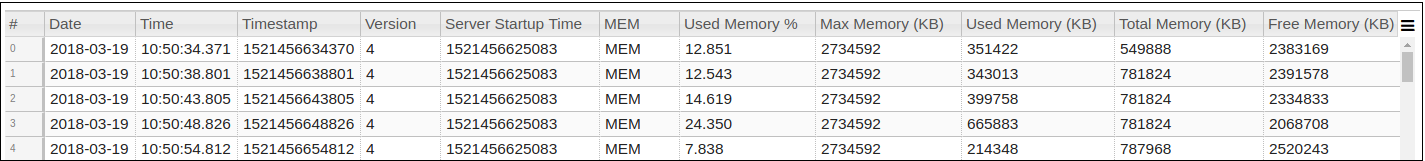
The Spreadsheet View allows you to explore a log file with features similar to those found in a standard spreadsheet application.
Key features include:
| Feature | Description |
|---|---|
| Column sorting | Click a column header to sort by that column. |
| Multi-column sorting | Hold Shift and click multiple headers to sort by more than one column. |
| Copy to clipboard | Press Ctrl + C on selected cells to copy their values along with column titles. |
| Cell selection | Select a single cell with a click, or click and drag to select multiple cells. |
| Keyboard navigation | Use arrow keys to move between cells. Hold Shift while navigating to extend the selection. |
| Hide columns | Use the hamburger menu in the top-right corner of the spreadsheet to hide or show columns. |
| Search bar | Filter rows by entering text in the search bar at the top of the page. |
Info
The search will match any value within a row. For example, searching for 500 will also match a cell containing 15004.
Text view
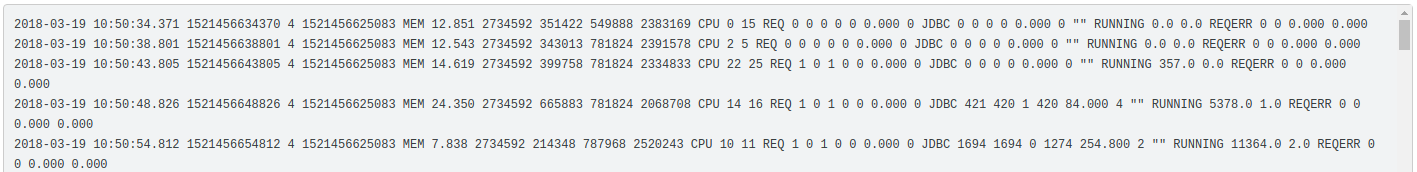
The Text view displays log file data in plain text format.
Note
Any log files that FusionReactor does not recognize will automatically be shown in plain text by default.
Top controls
| Control | View | Description |
|---|---|---|
| Today | All | Jumps to the current date and displays the most recent data for that day. |
| Compare Selected | Graph | Displays only the charts selected via checkboxes for side-by-side comparison. |
| Reset Selected | Graph | Restores the dashboard to its default view. |
| Sync Tooltips | Graph | Synchronizes tooltips across all graphs when hovering. |
| View | All | Opens a drop-down menu to switch between available views. |
| Export | All | Downloads data in different formats, depending on the current view. |
| Set Home Page | All | Sets the current page as your default FusionReactor home page. |
| Search | Text / Spreadsheet | Filters data in the current view based on entered search terms. |
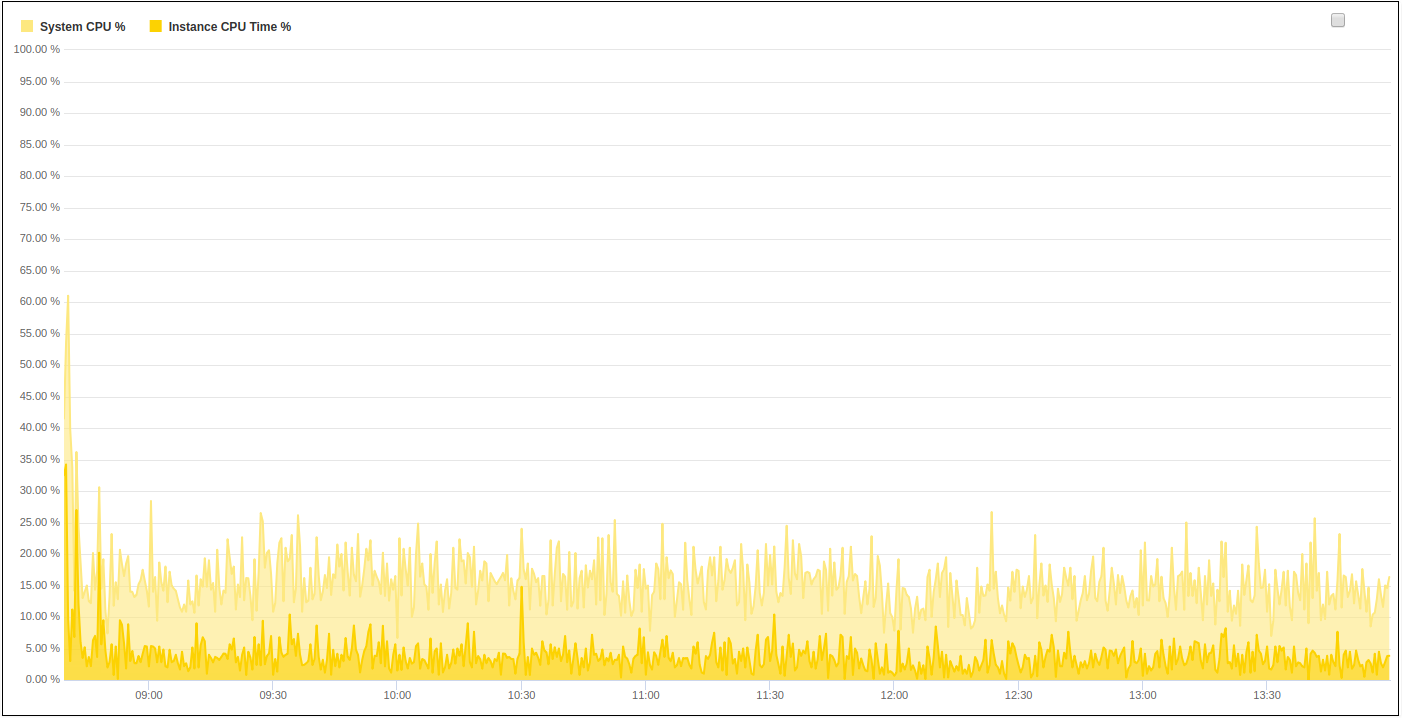
Sync tooltips
The Sync Tooltips feature allows you to pinpoint an event or metric spike at a specific moment in time and then correlate that point across all visible metric graphs.
Selected graphs retain context: using the date and time pickers while comparing graphs will not reset the view back to the dashboard. This makes trend analysis and cross-graph comparisons much more seamless.
Data handling & truncation
This section explains how the Archive Viewer handles and truncates data for performance and usability.
Data grouping
Data grouping replaces a sequence of data points in a series with a single representative point.
- Grouped values are calculated using an average approximation.
- This typically occurs for larger time periods to improve performance, prevent browser slowdowns, and make trends easier to identify in a chart.
Data Truncation
For performance reasons, data may be truncated in three ways:
- The line render limit is reached (see Archive Viewer configuration).
- The column in spreadsheet view reaches a fixed limit.
- The browser's container reaches a set height and stops rendering.
The default line render limit is 20,000 lines. We recommend not changing this, as increasing it may lead to browser slowdowns or crashes, and could risk JVM memory exhaustion.
If necessary, you can adjust this value under: Logging → Settings → Log Archive Settings → Line Render Limit
Other truncation methods are not affected by this setting.
Archive Viewer Configuration
As of FusionReactor 7.2.0, the Archive Viewer offers one configurable setting. You can access it via: Logging → Settings → Archive Viewer Settings
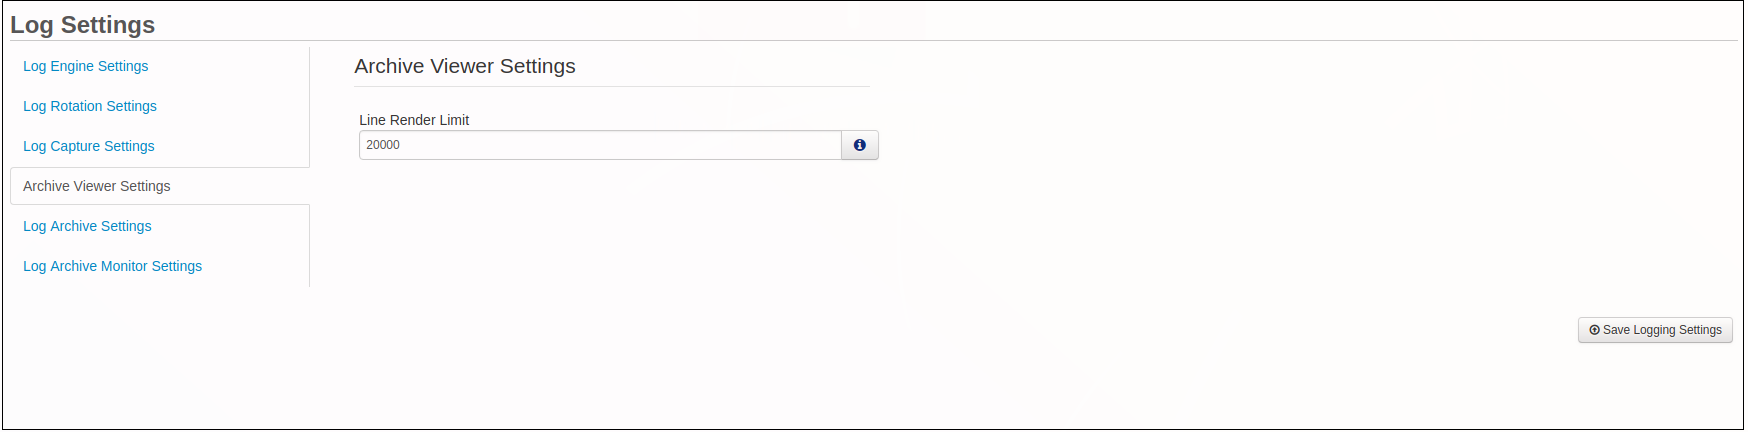
Line Render Limit
The Line Render Limit controls the number of lines FusionReactor reads, parses, and renders.
- Increasing this limit allows you to view more data from the log file.
- However, higher limits consume more system memory and can affect server performance.
Default: 20,000 lines – sufficient for most daily resource log files. Optional: For complex log files, increasing the limit may be beneficial, but should be done with caution.
Need more help?
Contact support in the chat bubble and let us know how we can assist.