ColdFusion System Metrics
ColdFusion System Metrics are only available for specific ColdFusion versions and server configurations.
Learn more
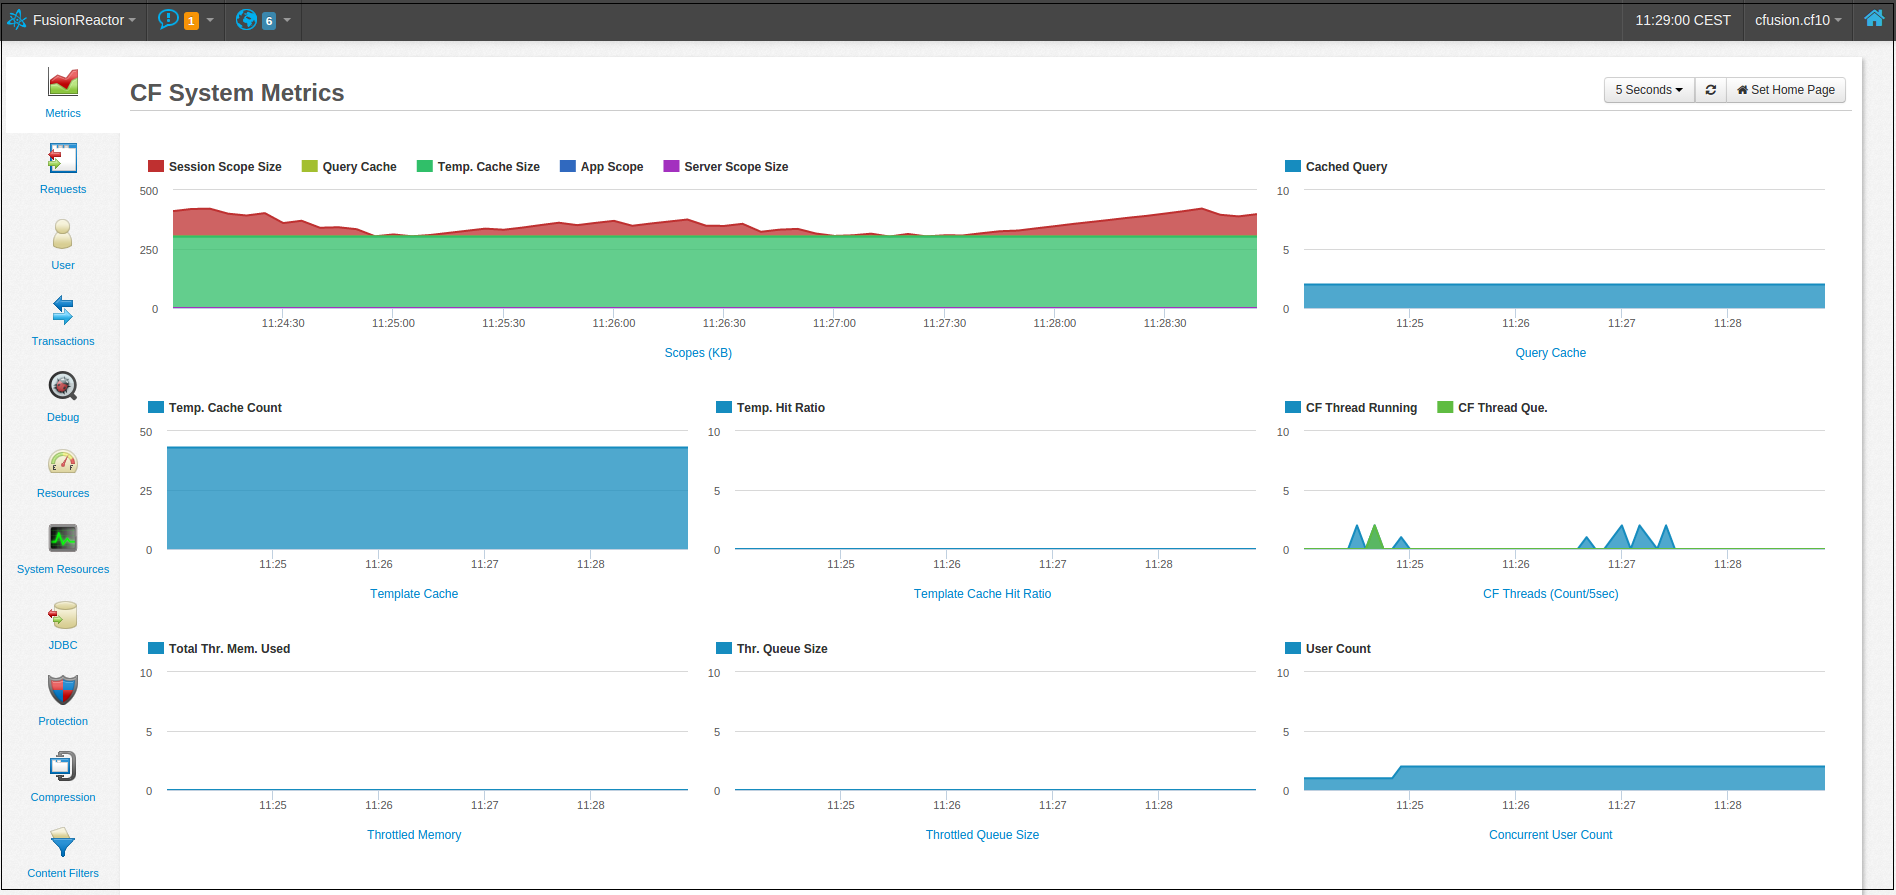
The ColdFusion System Metrics page is similar to the ColdFusion Metrics page but places greater emphasis on the internal management of requests within the server, rather than simply reporting which requests have been processed.
This page provides eight different graphs:
- Scopes
- Query Cache
- Template Cache
- Template Cache Hit Ratio
- CF Threads
- Throttled Memory
- Throttled Queue Size
- Concurrent User Count
Scopes
The Scopes graph provides an overview of the size of different ColdFusion memory scopes, as defined by the graph’s series. Monitoring these values helps identify memory usage patterns and potential performance bottlenecks.
The supported scope areas include:
- Session Scope Size – Memory used by active user sessions.
- Query Cache – Memory consumed by cached query results.
- Template Cache Size – Memory used to store compiled templates.
- Application Scope – Memory allocated for application-wide variables.
- Server Scope Size – Memory reserved for server-wide variables.
Info
The size of each is in KB.
Query Cache
The Query Cache graph displays the number of ColdFusion queries currently stored in the cache. This requires caching to be enabled in ColdFusion.
Template Cache
The Template Cache graph shows the number of template requests stored in the cache. This also requires caching to be enabled in ColdFusion.
Template Cache Hit Ratio
The Template Cache Hit Ratio graph illustrates the proportion of template requests served from the cache versus the total number of template requests completed at a given time.
CF Threads
The CF Threads graph shows the number of ColdFusion threads at a given moment.
This graph includes two series:
- CF Thread Running: The number of threads currently in the Running state.
- CF Thread Queued: The number of threads currently in the Queued state.
Throttled Memory
The Throttled Memory graph shows the amount of memory being throttled by ColdFusion. Requests exceeding the size threshold configured in ColdFusion will be throttled. Memory throttling must be enabled in ColdFusion.
Throttled Queue Size
If the Throttled Memory pool reaches its maximum size, requests exceeding the threshold are queued until space becomes available. This graph shows the number of requests currently in the throttling queue.
Concurrent User Count
The Concurrent User Count graph displays the number of users currently active on ColdFusion. This metric is measured using the <cflogin> tag.
Need more help?
Contact support in the chat bubble and let us know how we can assist.