Custom Metrics
On this page, you can view Custom Metrics. These metrics are typically submitted using the FRAPI method.
There are many overloaded methods on FRAPI that can be used to post metrics.
Learn more
Info
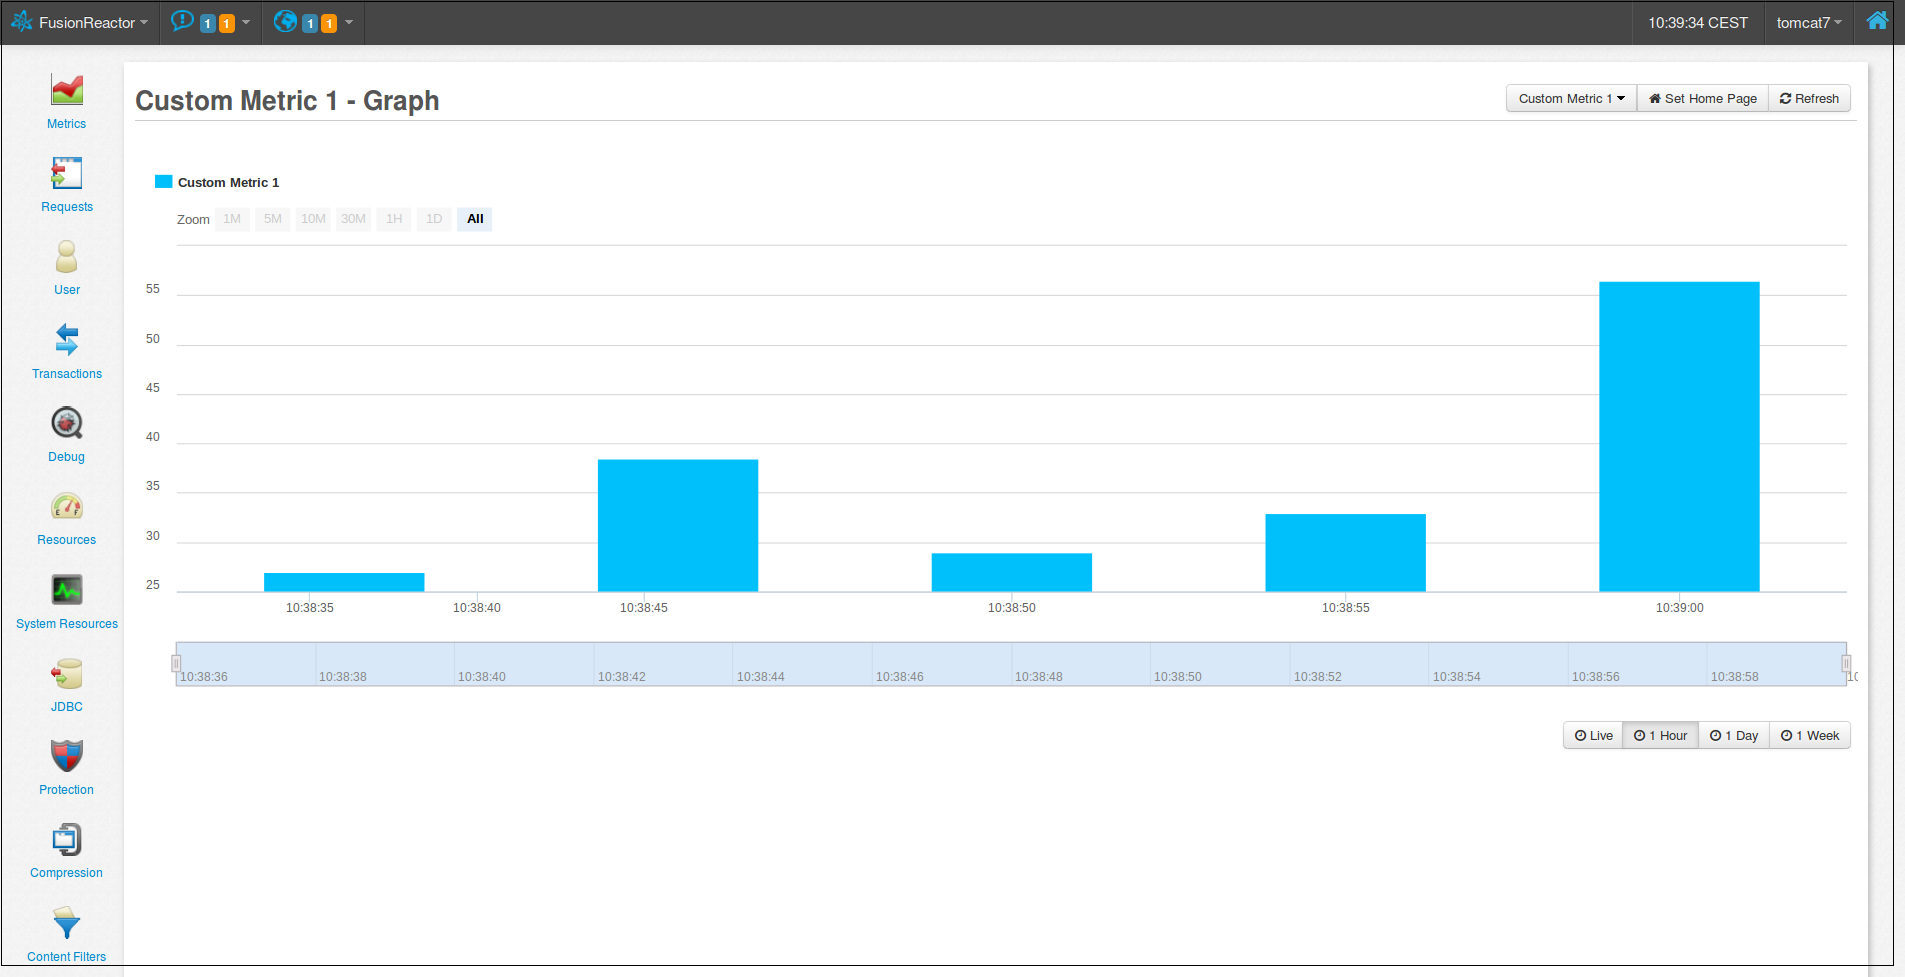
If a non-numeric metric is submitted to FRAPI, it will be displayed as a column chart instead of a line graph.
Changing Graph
You can change the displayed graph using the selector in the top-right corner of the page. The selector lists all currently available graphs.
Tip
If a graph is not listed, try refreshing the page. The selector updates only on page refresh.
Aggregates
The metrics engine can generate aggregates for collected metrics. By default, aggregates are calculated every five seconds, one minute, and one hour. Depending on the FRAPI method used, these aggregates can be enabled or disabled.
Buttons in the bottom-right corner of each graph allow you to toggle the available aggregates for that graph.
FRAPI frapi = FRAPI.getInstance();

for(int i=0; i<10; i++)
{
    frapi.postNumericAggregateMetric("MetricName",i);
}
Values submitted to the metrics engine through FRAPI calls do not trigger an automated sampler. As a result, the graph only displays the data points provided by the user, creating a Live graph that ends at the most recent point submitted. The graph will update immediately when the next point is added.
Need more help?
Contact support in the chat bubble and let us know how we can assist.