Overview
The Metrics page is similar to the Web Metrics page, with one key difference: you can filter the Request graphs to display a single transaction flavor.
This is particularly useful when monitoring a specific group of requests in combination with the FusionReactor API (FRAPI).
This page includes the following sections:
| Name | Description |
|---|---|
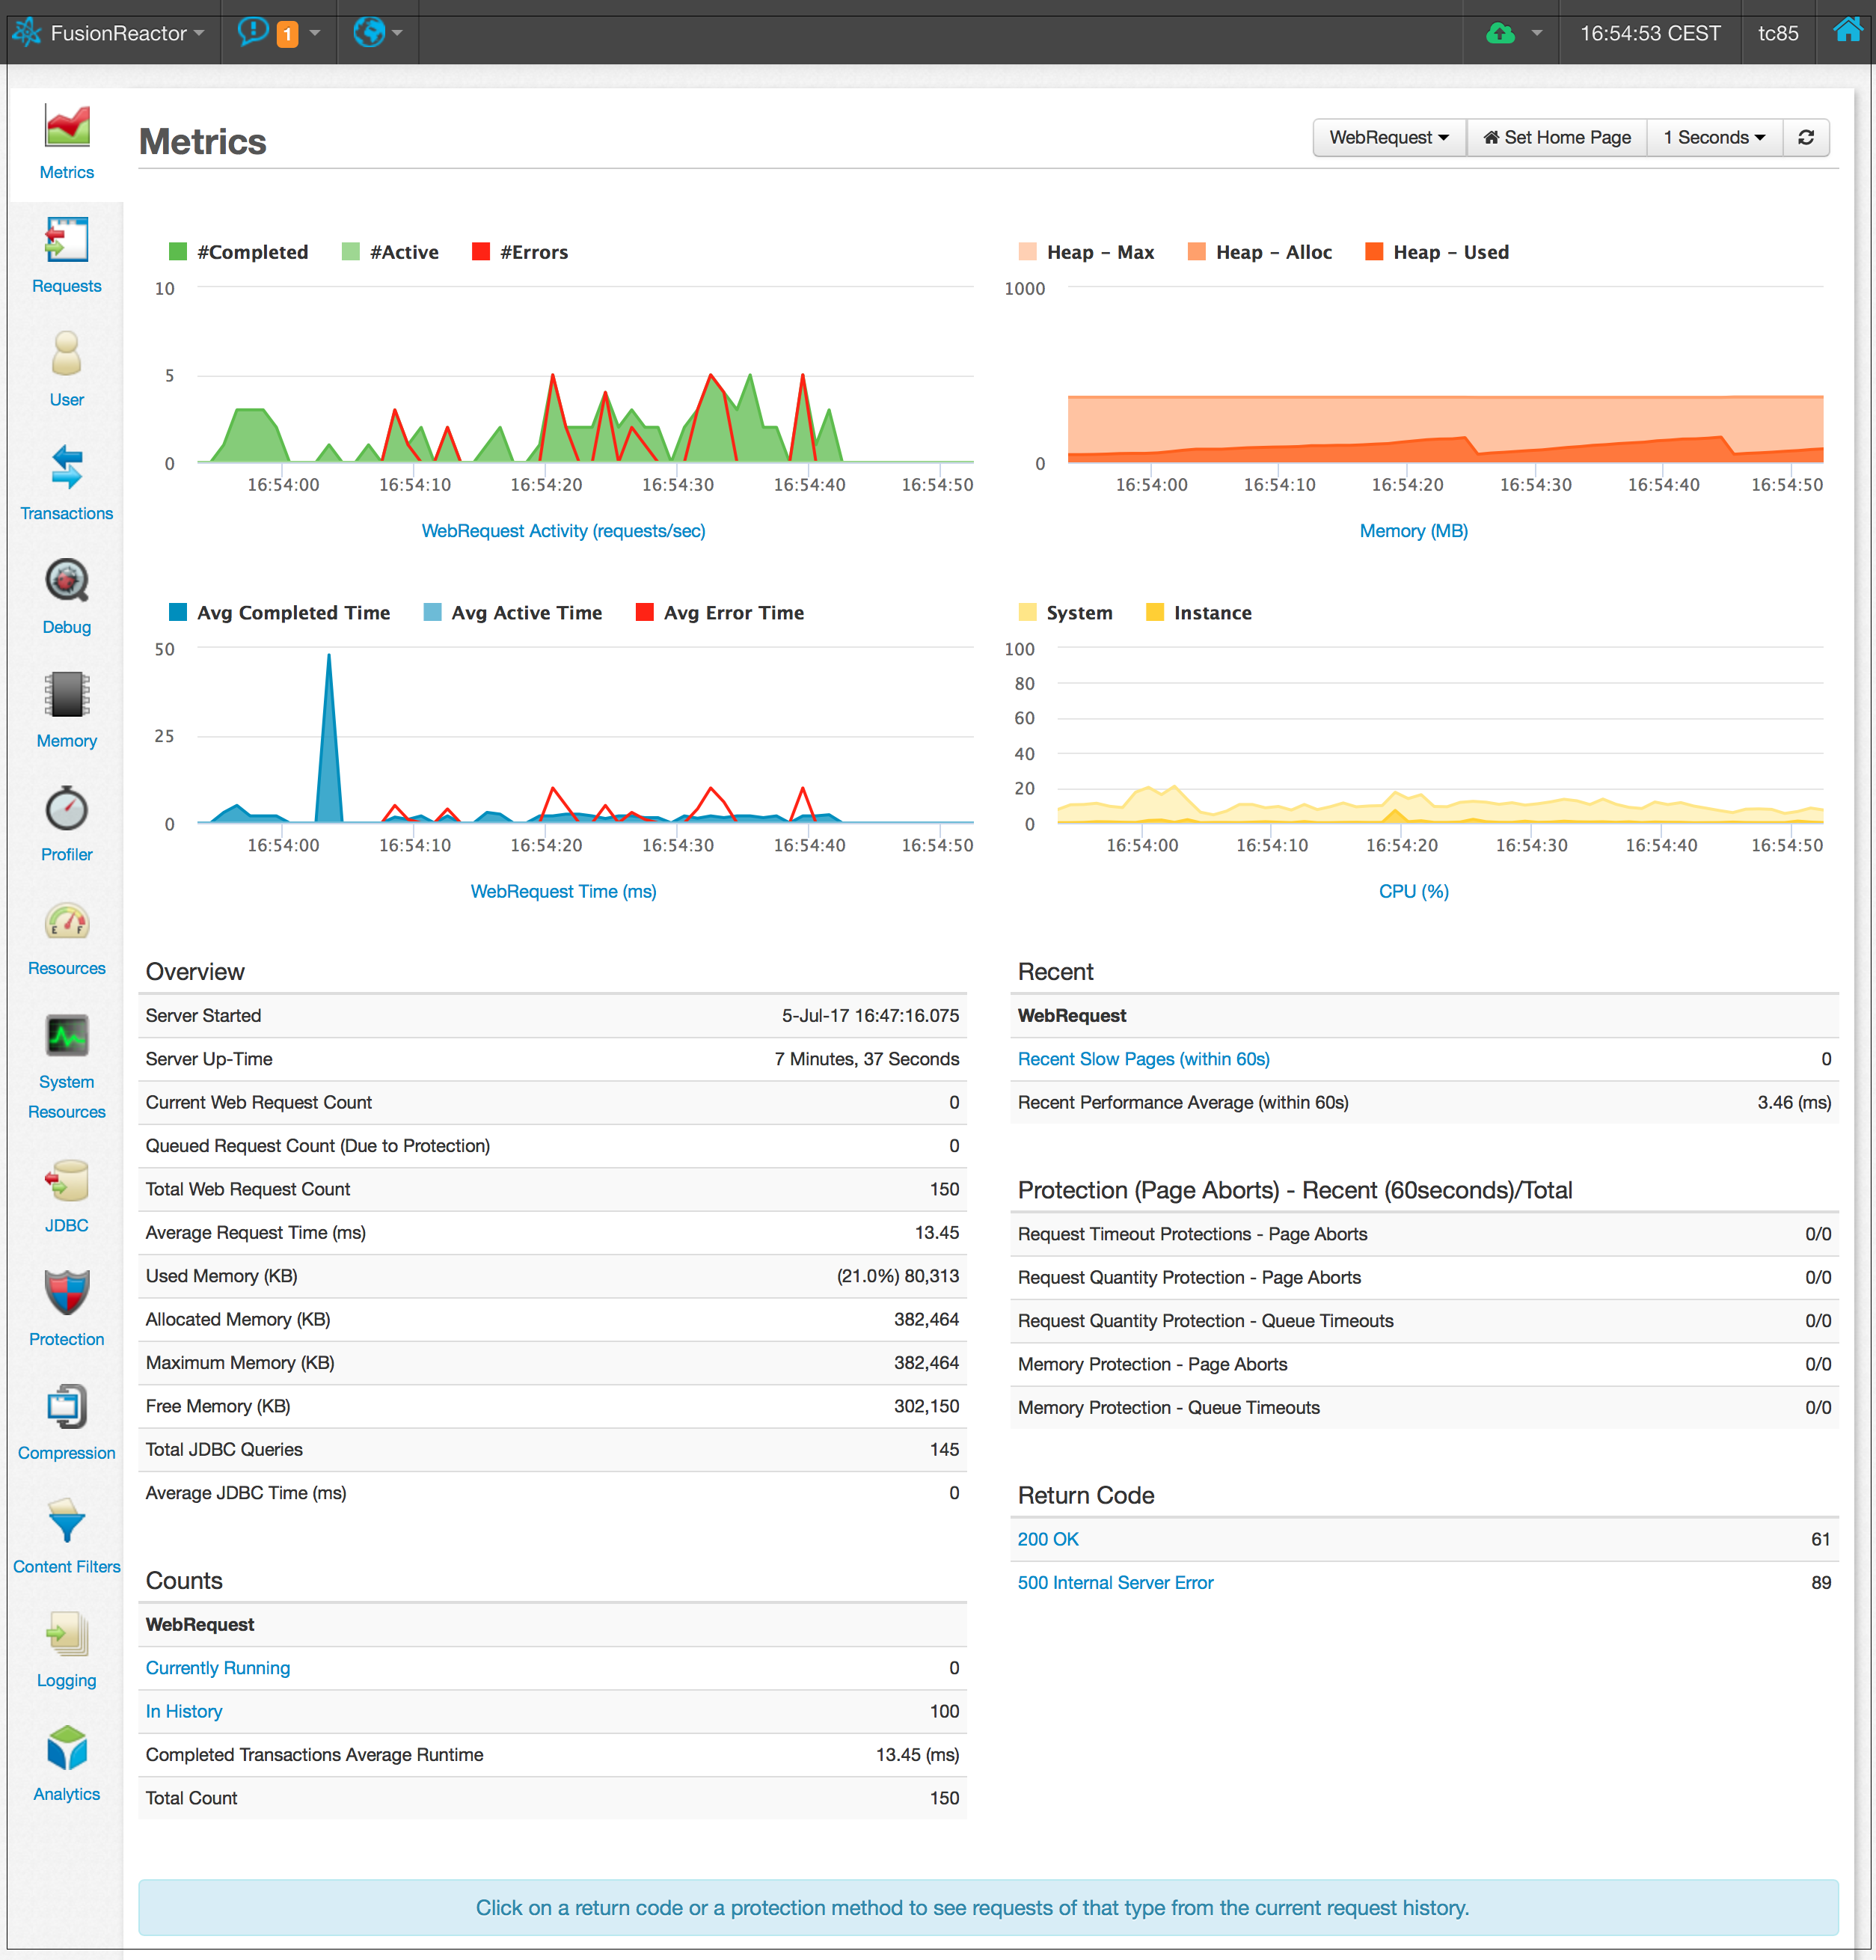
| Graphs | Displays 4 graphs: Request Activity, Request Time, Memory, and CPU. Click any graph title to open an enlarged version on a new page. The number and timing of web request errors are also tracked here. |
| Overview | Shows general statistics about the server. |
| Counts | Provides an overview of the currently monitored request type. Note: The In History value represents how many of this type are currently stored in the history, not the total that have run. |
| Recent | Displays statistics for actions on this server in the last 60 seconds for the monitored request type. The Recent Slow Pages link shows all requests from the current request history that exceeded the slow page threshold (defined in Request Settings). |
| Protection (Page Aborts) | Shows the number of pages aborted due to each of the three types of Protection. Clicking a Protection type displays all requests from the current request history aborted for that reason. |
| Return Code | Lists all HTTP return codes returned by this server. Each return code is clickable and shows all requests from the current request history with that code. |
Need more help?
Use the chat bubble to contact support - we’re happy to help.