Profiler
FusionReactor Profiler is on by default for any FusionReactor instances using an ULTIMATE, Developer or Trial license.
The profiler is designed to help you identify performance bottlenecks in your production environment with VERY low overhead, so you gain maximum benefit, without impacting your running applications. The profiler can be configured to run on demand, so that it will automatically profile your application as soon as it detects a long running request or thread. You can limit the number of profile samples which are taken, ensuring that impact on your production environment is minimized. Our tests have shown that even with limited samples, the insight you gain into performance bottlenecks is invaluable.
Slow Requests / Transactions / JDBC
The profiler will sample any transaction which runs longer than 3 seconds. Once a transaction is monitored as being over this threshold, the Production Profiler will start to sample (profile) the transaction and store the call stack. When that process is going to start, an orange clock icon is going to appear on the top navigation bar of your screen. This is the Production Profiler icon.
When you press the Production Profiler icon, you will be taken in the Active Profiling tab where you can locate all the slow currently running transactions, you can also access the Active Profiling tab by navigating to Profiler > Active Profiler.
All the slow running transaction that are currently being profiled, can be found under the Active Profiling tab. See screenshot below.

Any finished slow transactions that have been profiled can be found under the Profile History tab, under Profiler > Profile History. See screenshot below.

The profiler will sample the transaction every N milliseconds, ( 200ms is the default )the Profiler Sample Rate can be configured in the Settings tab of the Production Profiler.
Profile Threads
The Profiler supports monitoring any arbitrary thread. This can be started or stopped from the Resource > Threads page in FusionReactor by pressing the small clock icon.

Once the profiler has been started for a thread the Profiler context will appear below the thread name, similar to the transaction view. See screenshot below.

Additionally, you will be able to locate the Thread under the Active Profiling tab, if it's currently running. See screenshot below.

Or the Thread can be found under the Profile History tab, if the profiler has stopped. See screenshot below.

Profiling a specific thread is limited to 60s by default as leaving the profiler running for a lot time will generate very large thread information. This limit can be configured in the Profile Settings for the Profiler or can be found in the Settings of the FusionReactor Production Profiler plugin configuration.
Profiler Details
This section is going to provide you with more information about the Code Profiler Details of a transaction or thread. When you need to discover what part of an application (method) consumes the most amount of CPU and Time, you can use the profiler to do that. Essentially the Code Profiler can be used to isolate performance bottlenecks in your code.
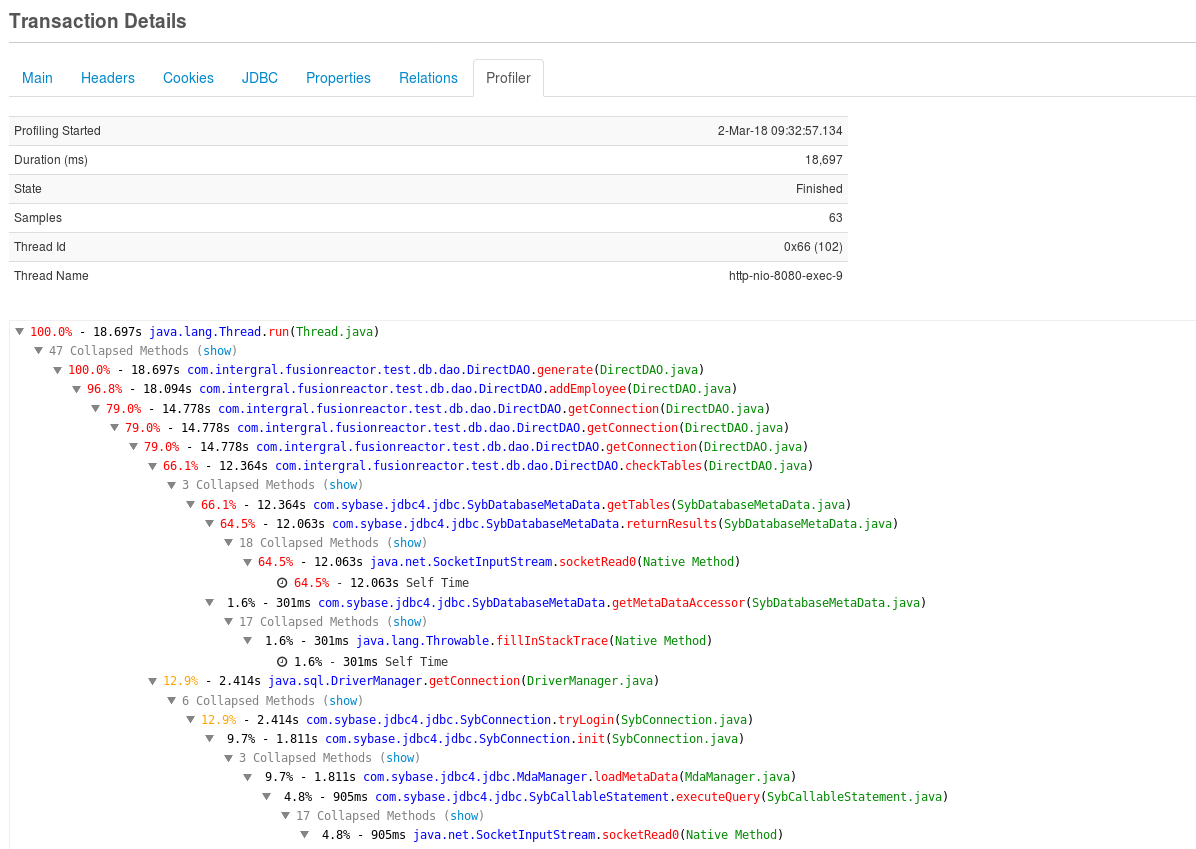
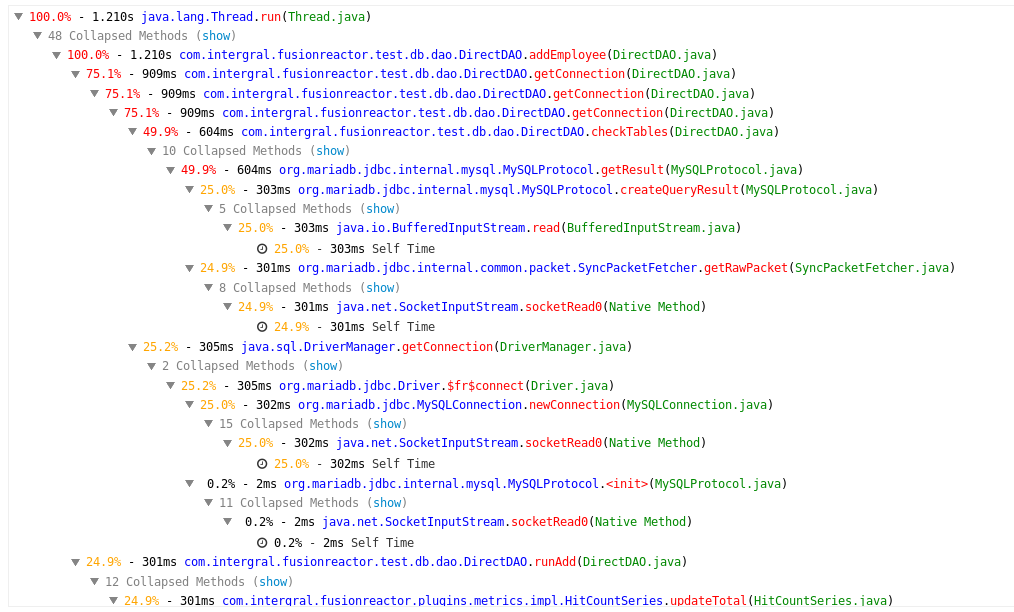
When you access the Profiler tab in the transaction details, you should be able to see something similar. See screenshot below.
Details
The first part of the page is going to provide you with general information about the transaction or thread.
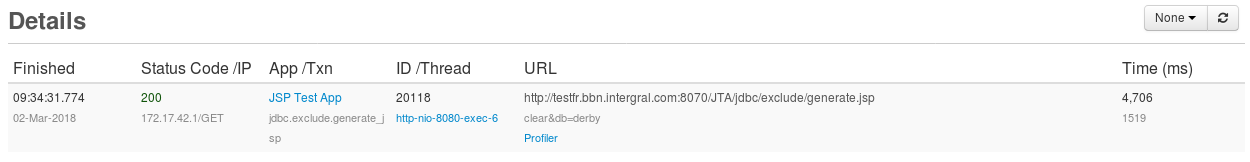
For example, you could see if the transaction or thread is running, if it's finished and the time that it finished. You can also see the status code/IP, the application that generated the transaction, the ID/thread, the URL of the transaction or thread and finally, the total amount of time in milliseconds the transaction or thread took to complete.
Transaction Details
Most of the Transaction Details remain the same, more information about transaction details can be found here; Transaction Details. However, in the latest version of FusionReactor (6.2.0) there are a number of changes made to the Profiler tab.
The new implementations are the following:
- You have the ability to decompile a class (Blue color line).
- You have the ability to decompile a Method (Red color line).
- You have the ability to add an breakpoint into a Method (Green color line).
- You can now see the individual times of each call in the Profiler window. This is represented as something similar to the following 3.0% Self Time.
Info
Please note that you cannot access, decompile or debug any native methods.
Examples
Based on the screenshot below, we are going to demonstrate the new features of the Production Profiler with simple examples.
Example1: Decompile a class
Based on the following screenshot, we are going to decompile the class: java.sql.DriverManager

By clicking the package identifier a new window is going to appear. See screenshot.
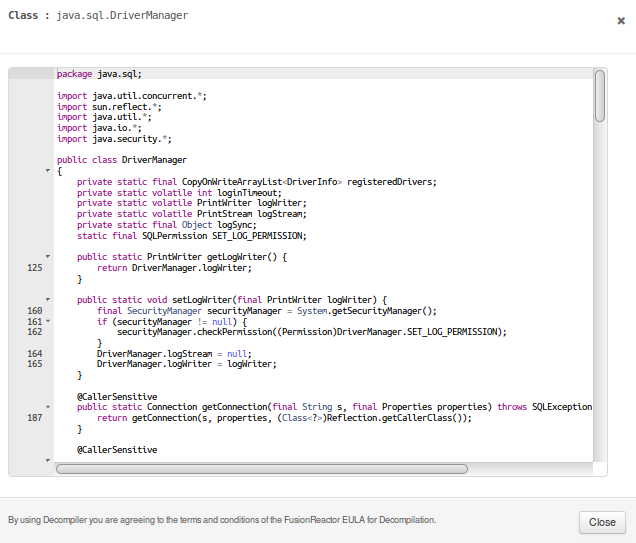
You now have the ability to view the decompiled class.
Example 2: Decompile a Method
Based on the following screenshot, we are going to decompile the
Method: getConnection

By clicking the method name, a new window is going to appear. See screenshot.
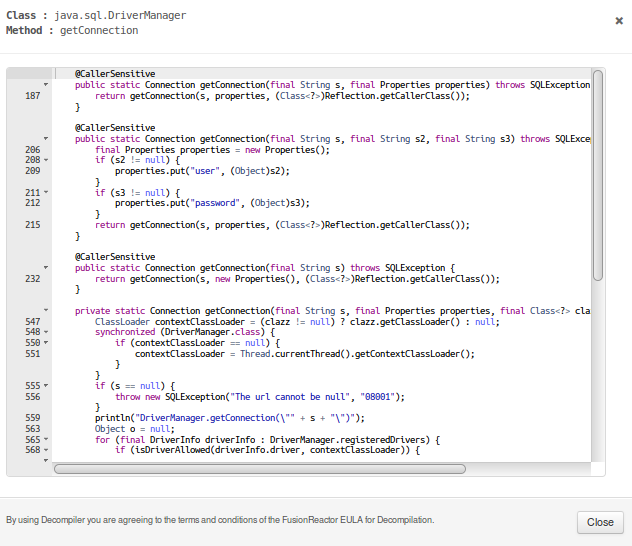
You now have the ability to view the decompiled Method.
Decompilation is not enabled by default if you are accessing FusionReactor over the external web server.
Learn more
See System properties - decompilation for more information on how to enable decompilation and more locations to decompile a class.
Example 3: Add an Entry Point into a Method
Based on the following screenshot, we are going to add an entry point into the Method: DriverManager.java

When you click the Class name, a new window is going to appear. See screenshot below.
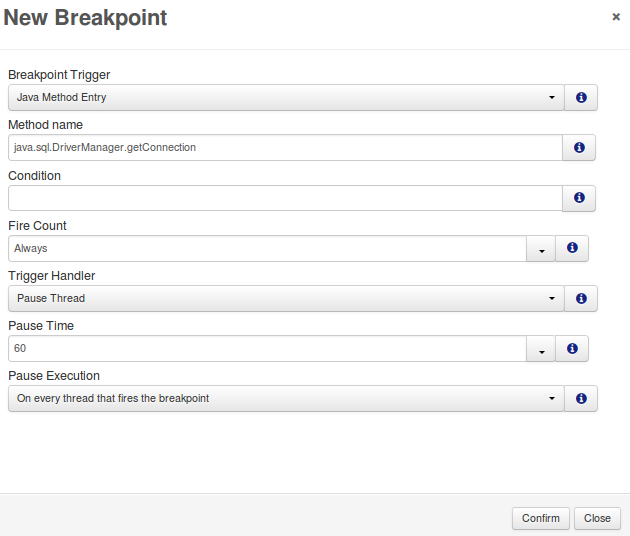
You can create a new Breakpoint based upon your needs. More information about the configuration of the Breakpoints can be found here, Breakpoint configuration. When a new Breakpoint has been created, it can be viewed in FusionReactor under Debug > Breakpoints. For more information see the following link, Production Debugger
Example: Lock links
As of FusionReactor 7.5.0, profile stack traces containing locks now have links to the 'Stack Trace All Threads', and will filter the thread list to show threads which have either acquired or are waiting on that particular lock.

Upon filtering, a banner is shown at the top of the page to show this.

More Examples
The examples below are going to provide you with useful information of how the Profiler works. Theses examples will give you a better understanding of how the information in the Transaction Details tab can be used and how the information can be used in order to identify bottlenecks in a production environment.
- Use the Resize Image method with a ColdFusion Example.
- Read a file, Create a new file and add a new lines.
- Read - Delete - Create a new file and add a new lines.
- Create a PDF file with images.
- loop.jsp file that reads each line from a file and prints the output.
Learn more