Visualizing your metrics
Metrics provide ongoing visibility into numerical and statistical data about your applications and services. For example, you can track CPU utilization, memory usage, or concurrent user counts in real-time.
To visualize your OTel metrics, simply navigate to the Explore tab in FusionReactor Cloud. Alternatively, create your own personalized dashboards to provide a tailored view of your application's OTel metrics.
Learn more
Python example
Info
The following example relies on a user having first instrumented a Python application to ship data to FR Cloud.
In the FR Cloud Explore window, ensure the metrics datasource is selected. Then either use the Builder to find your metric (you can search for job: fib_by_iteration), or use the following in Code search mode: fib_iteration_counter_total{job="fib_by_iteration"}. You'll get a graph and table of the metric.
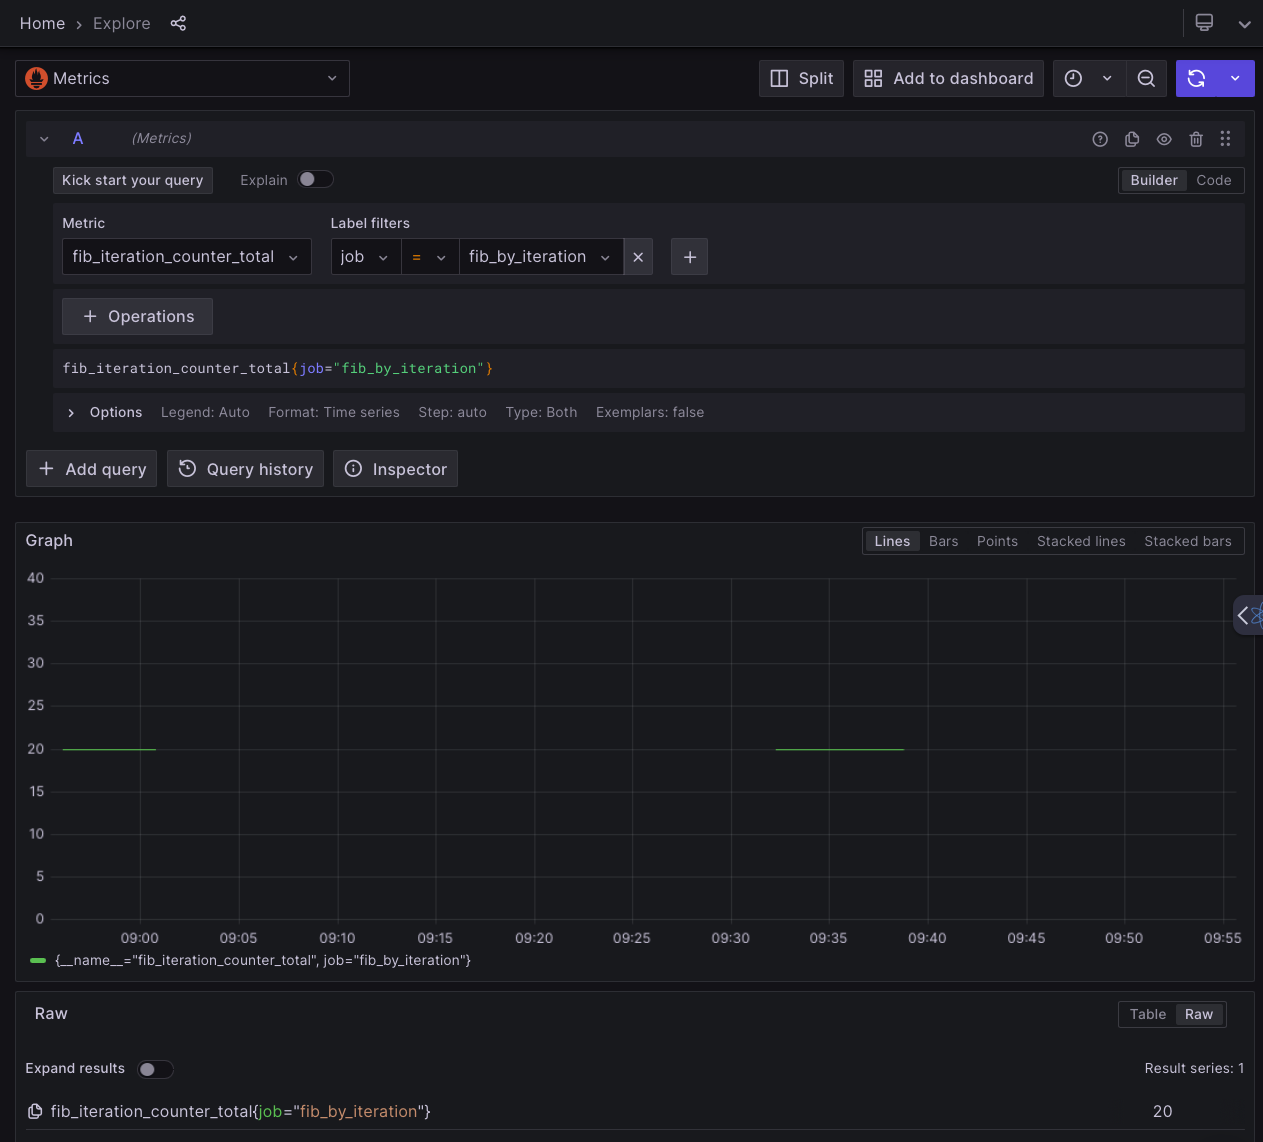 Metrics supplied by Python