Traces
Traces represent individual execution flows within your application, capturing what happens from start to finish. They record important details including timings, events, attributes, sub-routine executions, and custom data. This data is organized in a hierarchical tree structure that mirrors your code's execution flow.
A trace typically represents a single request or operation, and serves as a container for spans. These spans are linked together under a unique trace ID, with each span representing an individual step in your business logic.
To visualize your OTel traces, simply navigate to FusionReactor Cloud and access the Show Traces dashboards, which provide comprehensive tracing features without requiring additional configuration. Alternatively, you can view your traces in Explore by selecting Traces from the datasource dropdown.
Python example
Info
The following example relies on a user having first instrumented a Python application to ship data to FR Cloud.
In the FR Cloud Explore window, ensure the Traces datasource is selected. Using the Search query type, select Resource Service Name = fib_by_iteration. Click the Run Query button at the top left to execute the query.
Several fib-outer spans will appear. Click on one to open the span split view, which displays the inner spans for that execution. Click any inner span on the right to view more information, including the iteration attribute set in the code.
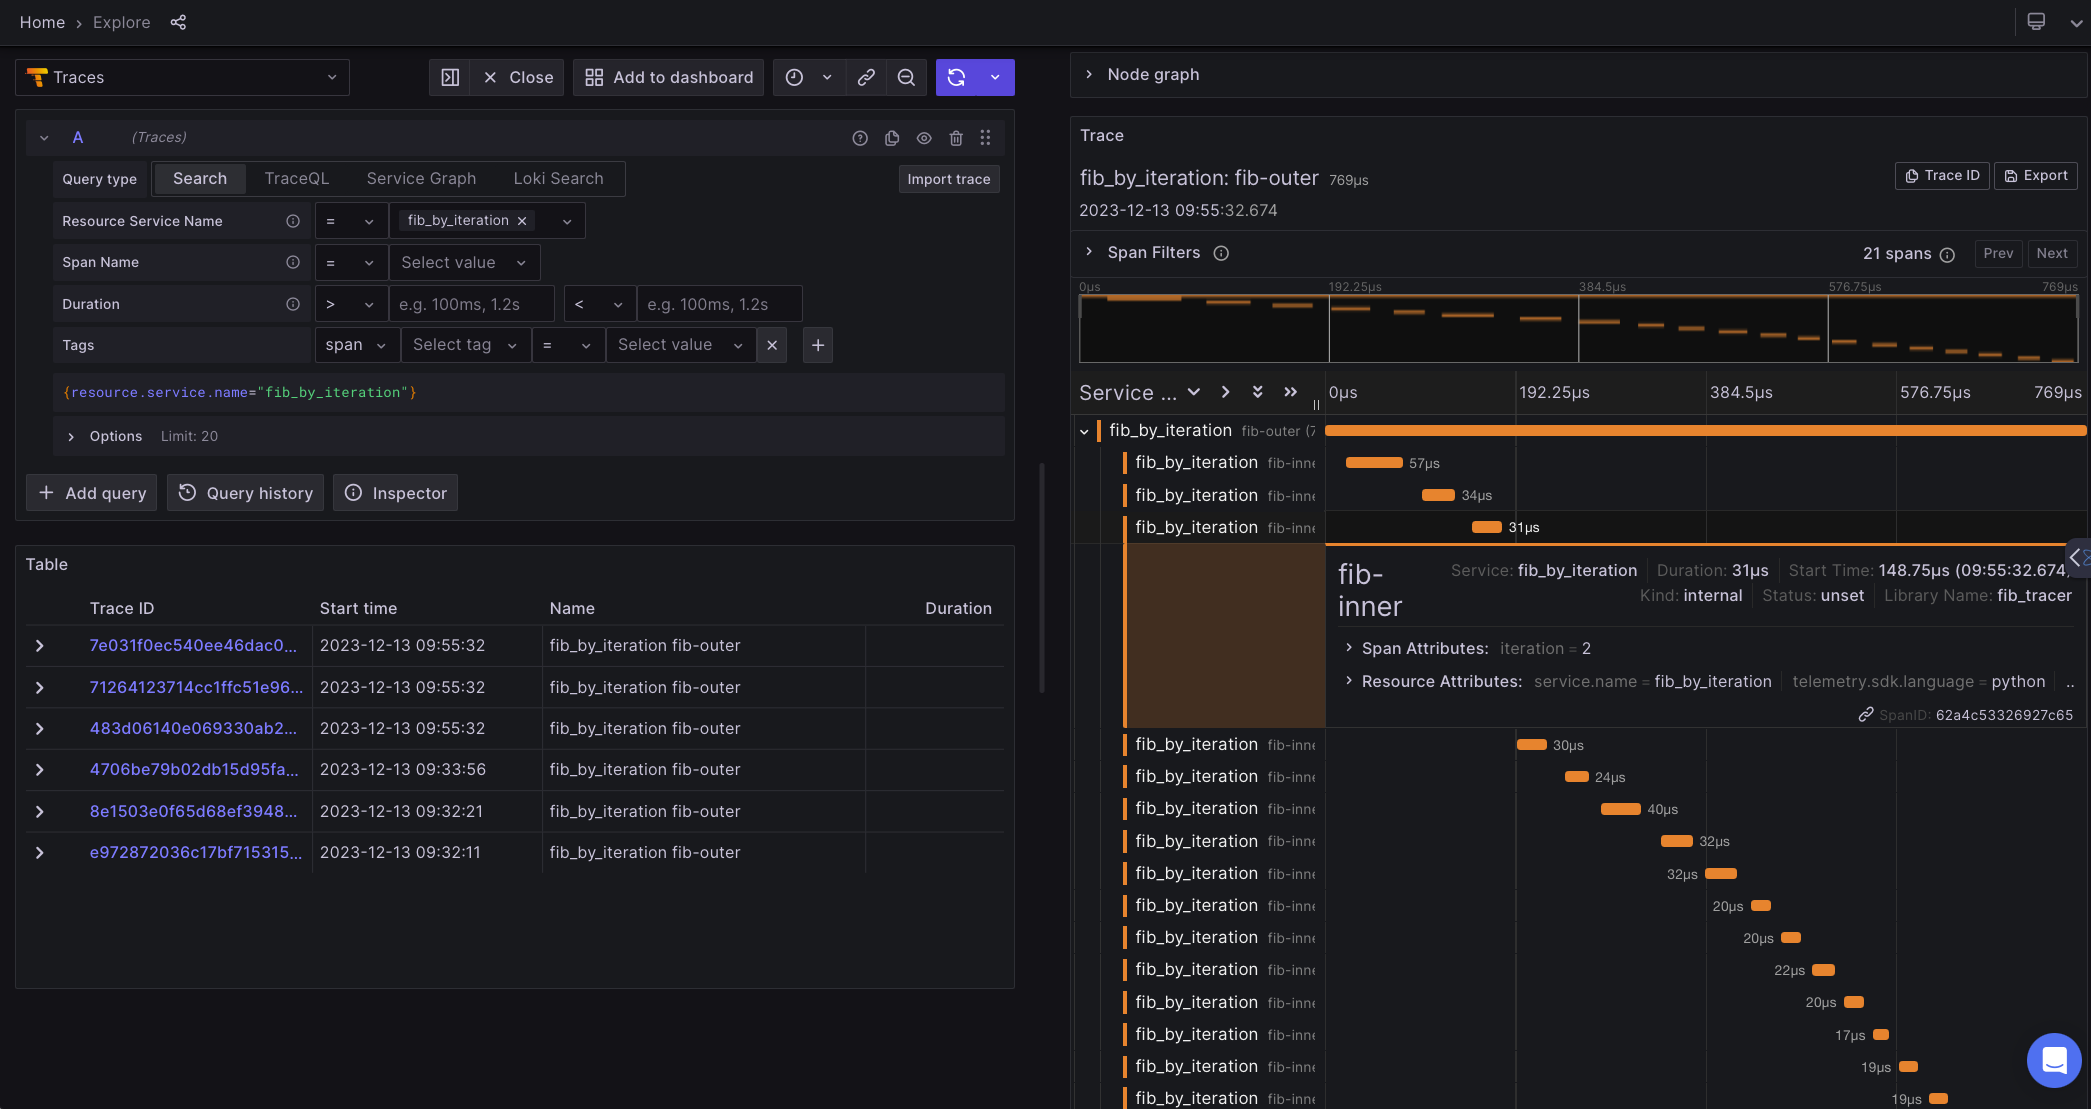 Traces supplied by Python