Servers
Overview
FusionReactor Cloud introduces Server Scenes, a powerful new feature providing a high-level view of your infrastructure and services. This documentation explains how to use and get the most out of the Explore: Servers functionality.

Note
Explore: Servers is currently in preview. While fully functional, the feature is under active development and may receive updates and improvements based on user feedback.
Accessing Server Scenes
- Navigate to the FusionReactor Cloud dashboard.
- Click the Explore tab in the top navigation bar.
- Select the Servers button.
Key Features
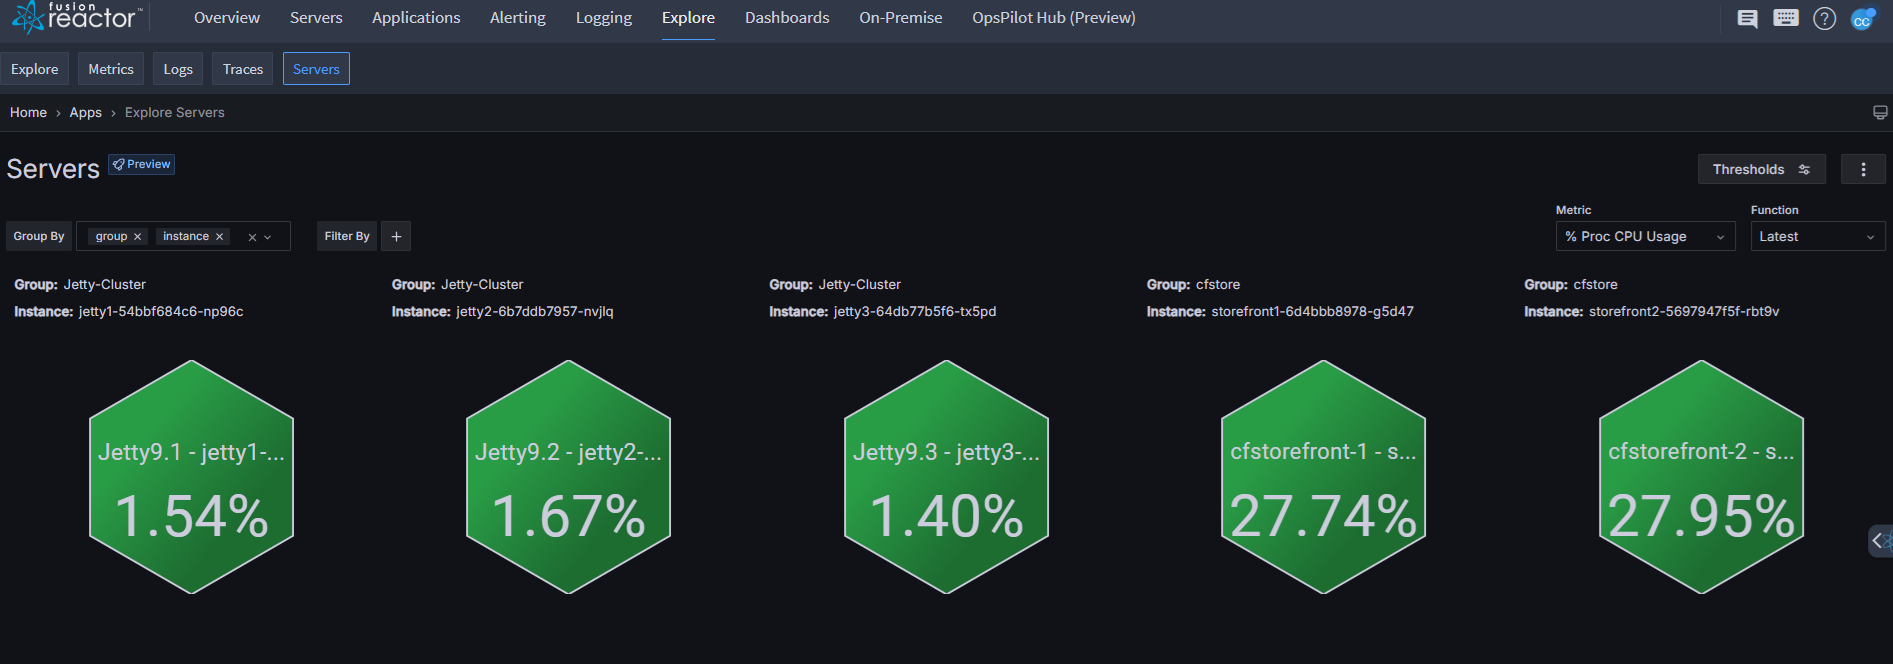
- Visual Health Dashboard: Hexagonal tiles represent each server, displaying key metrics with color-coding for instant health assessment.
- Grouping Capabilities: Servers can be organized into logical groups (e.g. Jetty-Cluster).
- Flexible Filtering: Robust filtering options to focus on specific server sets.
- Customizable Metrics: Choose which metrics to display (e.g. % Sys CPU Usage).
- Dynamic Updates: Real-time metric updates for continuous monitoring.
Visual Indicators
Each hexagon displays:
- Server name
- Current metric value as a percentage
- Group association
Detailed Server Metrics
Accessing Detailed Views
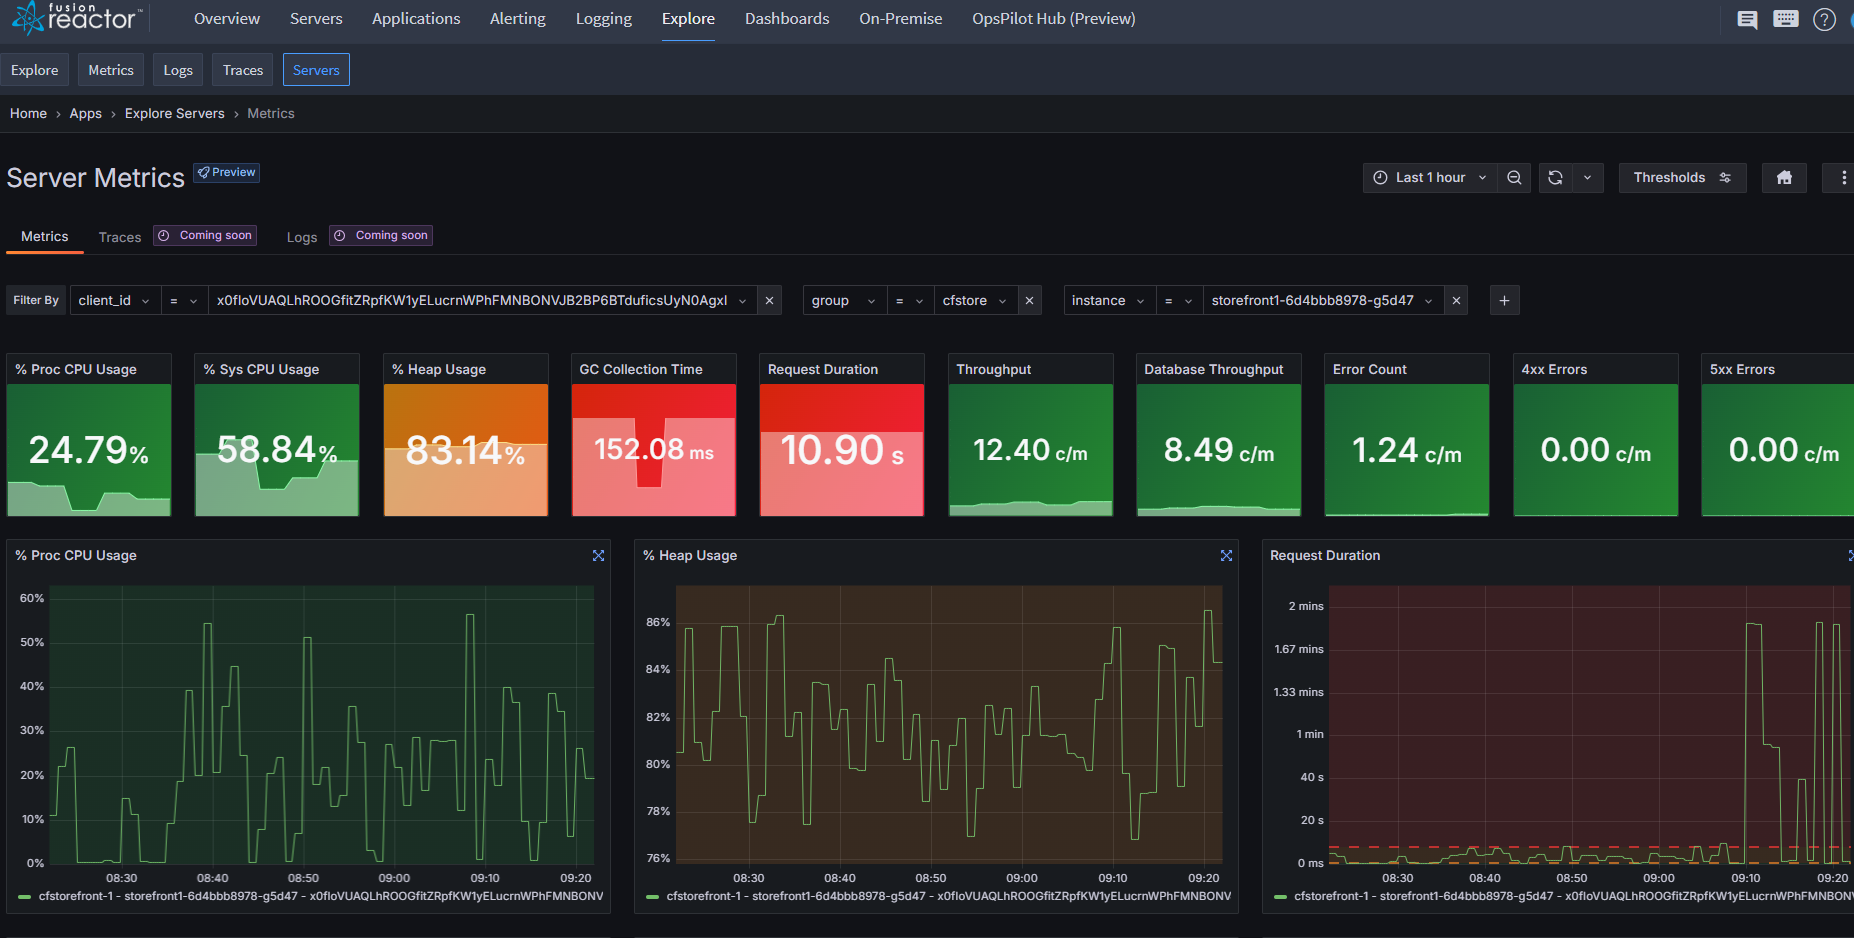
Click any server hexagon to access comprehensive metrics, including:
- Proc CPU Usage
- Sys CPU Usage
- Heap Usage
- GC Collection Time
- Request Duration
- Throughput
- Database Throughput
- Error Counts (4xx and 5xx)

Graph Features
- Interactive time-series data visualization
- Real-time updates
- Customizable timeframes
- Auto-refresh capability
Tip
To expand any graph, click the icon in the top right corner.
Threshold Configuration
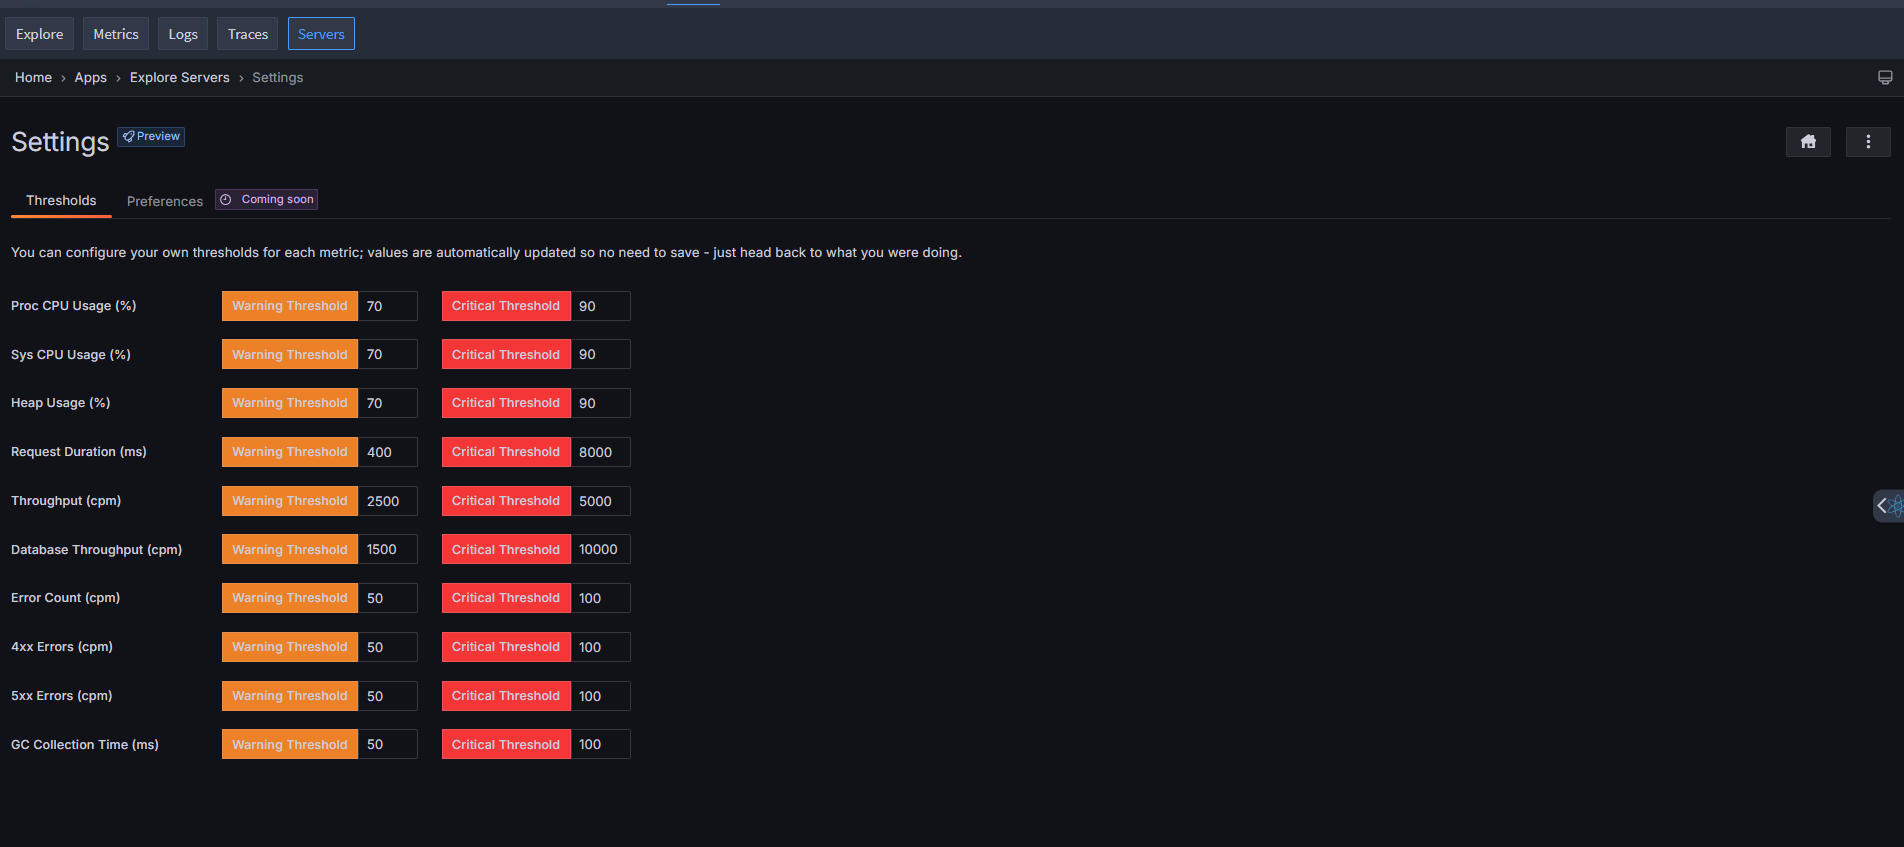
FusionReactor Cloud allows you to configure warning and critical thresholds for each metric. These thresholds are automatically saved as you modify them - no manual saving required.

Understanding Thresholds
- Low: Normal operating conditions.
- Medium: Indicates potential performance issues that need attention.
- High: Indicates serious performance problems requiring immediate action.
Customizing Thresholds
- Navigate to Explore > Servers > Settings > Thresholds.
- Locate the metric you want to adjust.
- Input new values for Warning and Critical thresholds.
- Changes are saved automatically.
- Return to the Servers view to see the updated color-coding.
Tip
Regularly review threshold settings to match your infrastructure requirements.