Request Details
You can get to the Request Detail page from any page which lists requests and pages linked from Request Metrics.
Clicking the Request Details button by a request or clicking on the URL field takes you to a page containing detailed information about that request.
Tab Selection
At the top of the Request Details page is a copy of the request line from the page you came from. Underneath are at least 5 tabs, plus 1 for each context on that transaction.
The available tabs are as follows:
| Name | Applicable Request Types |
|---|---|
| Main | All types. |
| Headers | Web Request, HTTPClient |
| Trace | JDBC, MongoDB |
| Cookies | Web Request, HTTPClient |
| JDBC | Web Request, JDBC |
| Properties | Web Request, MongoDB, FRAPI, HTTPClient |
| Relations | All types. |
| Profiler | All types. |
| Error | All types. |
| Query Plan | JDBC |
| AMF | Web Request |
| Traces | Web Request, FRAPI |
| Aggregates | JDBC |
| Json Data | Web Request, HTTPClient |
| Logging | Web Request |
| Event Snapshot | Web Request |
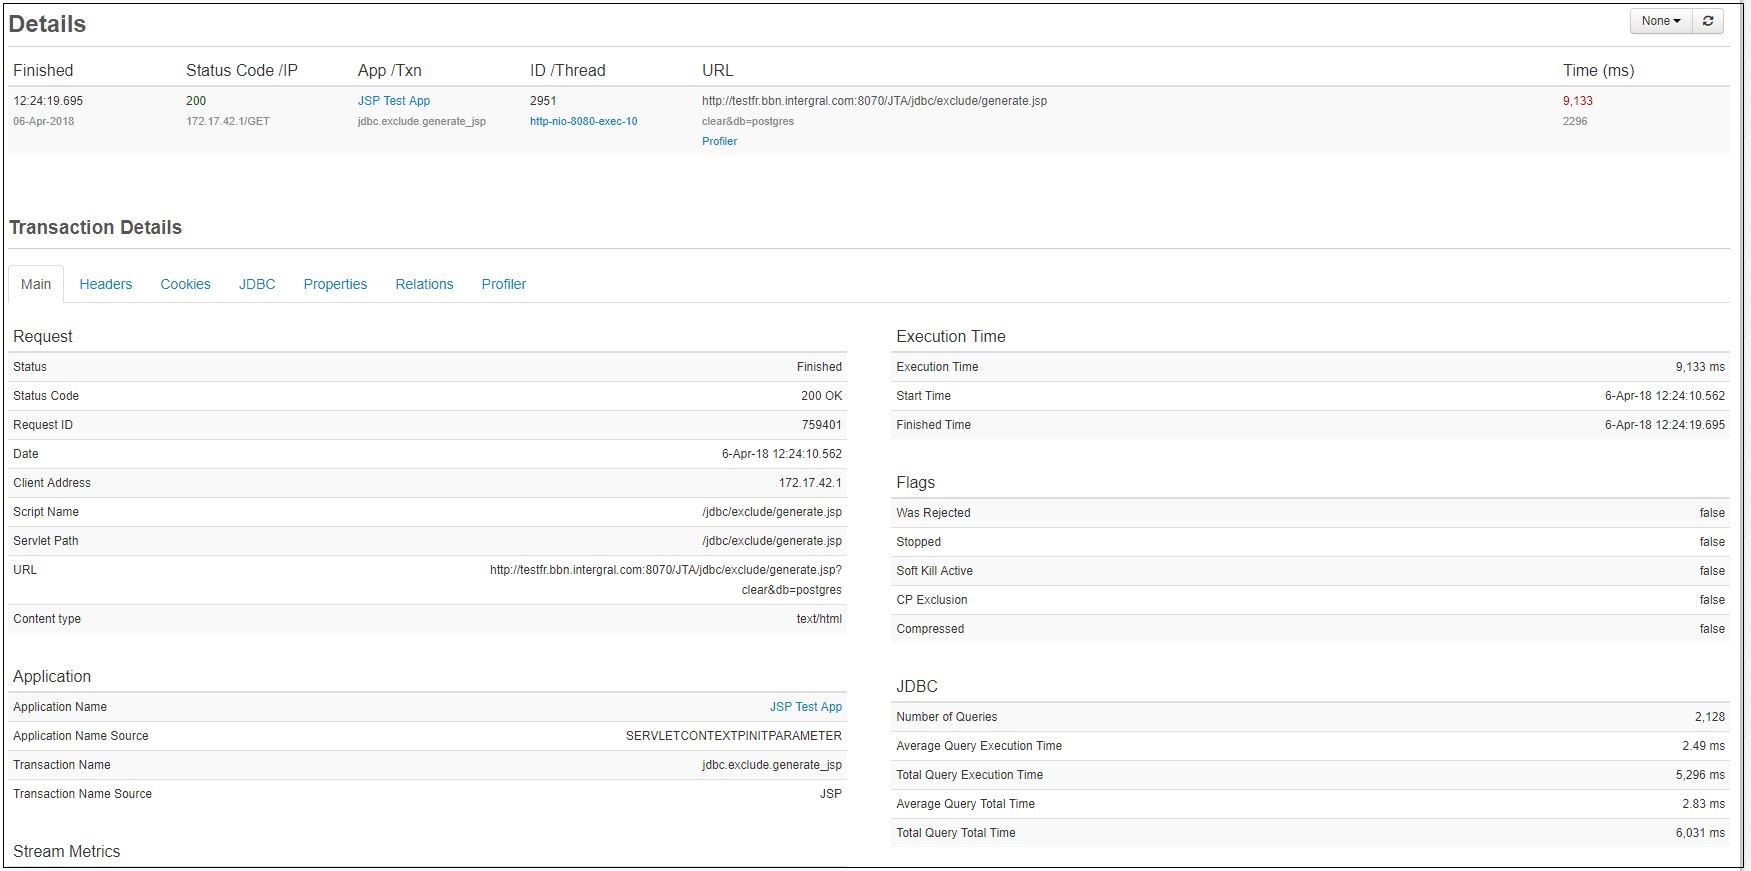
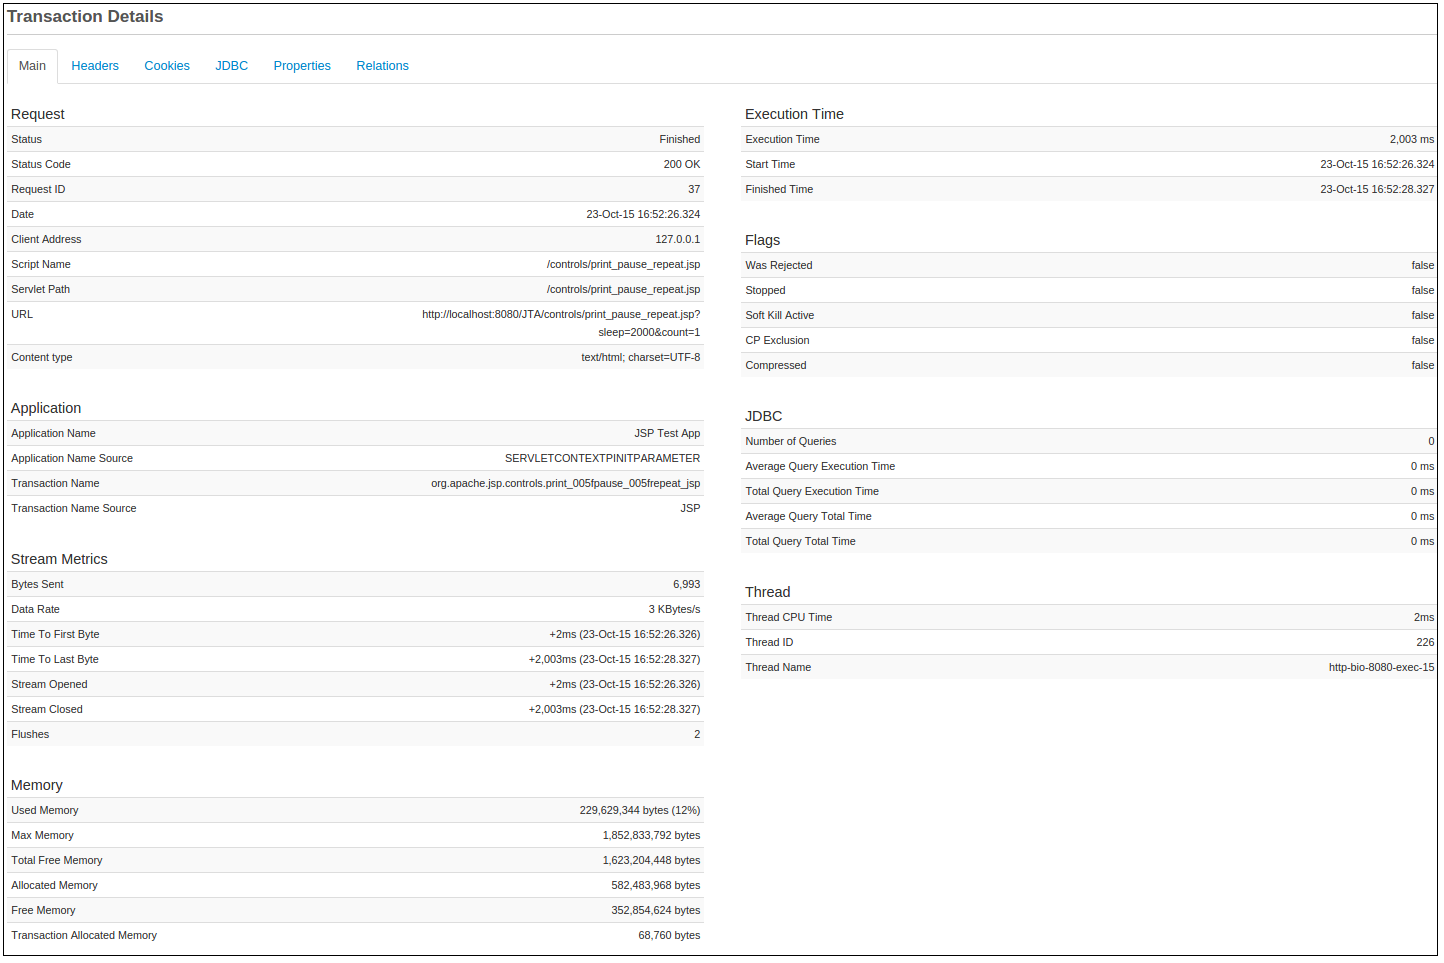
Main
The Main tab shows general information about a request such as script name, execution time, memory levels and flags.
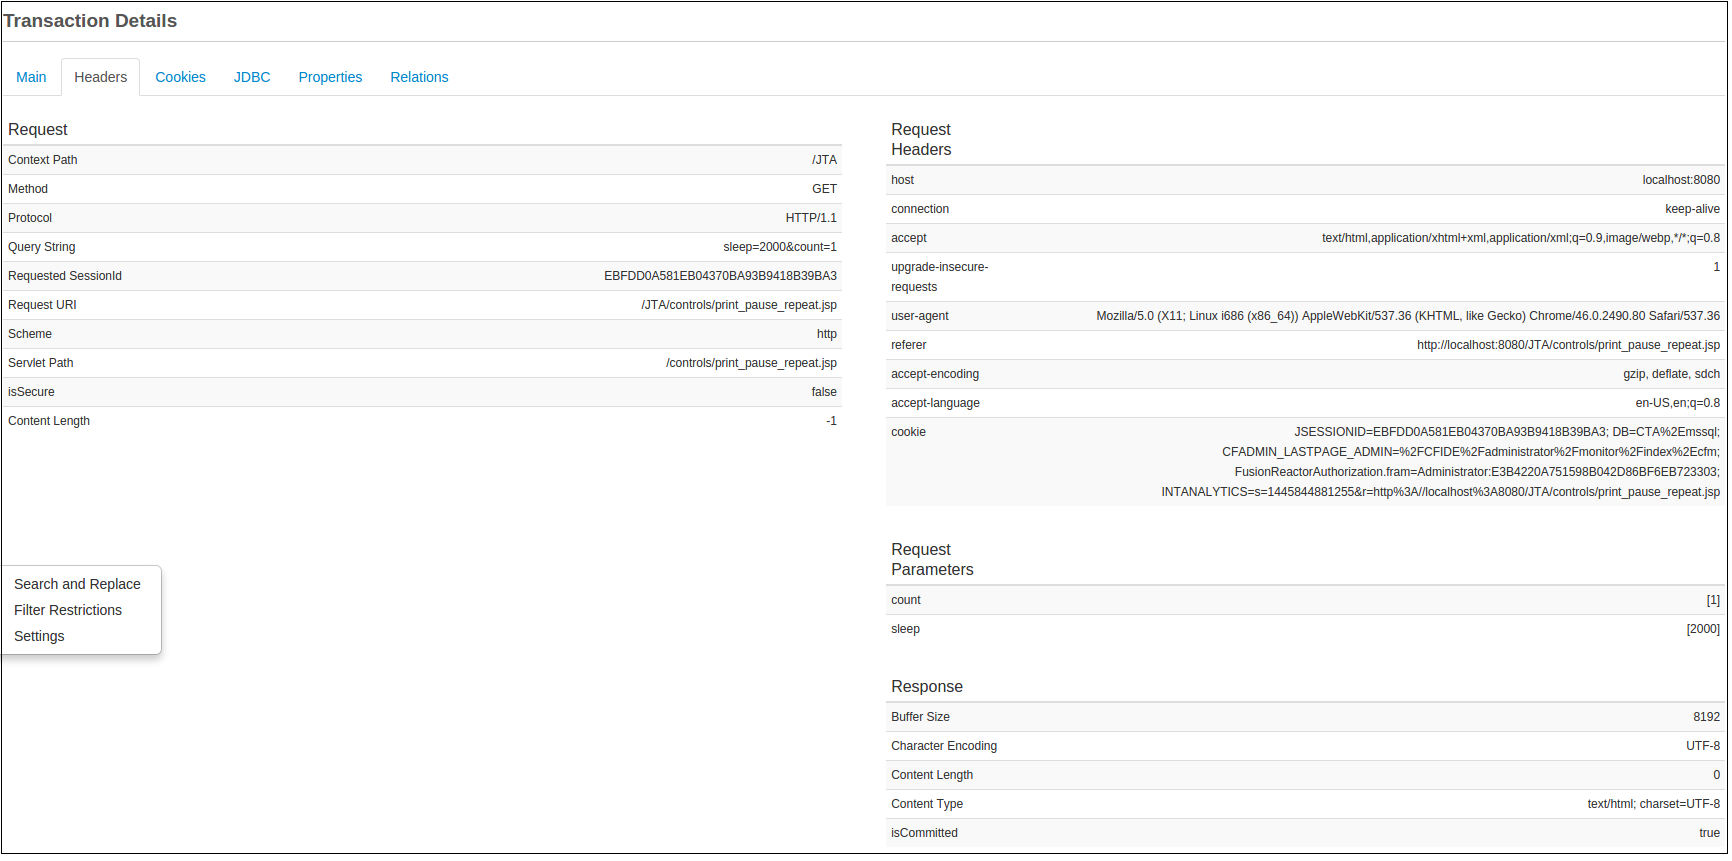
Headers
The Headers tab shows the HTTP headers for the request and response objects.
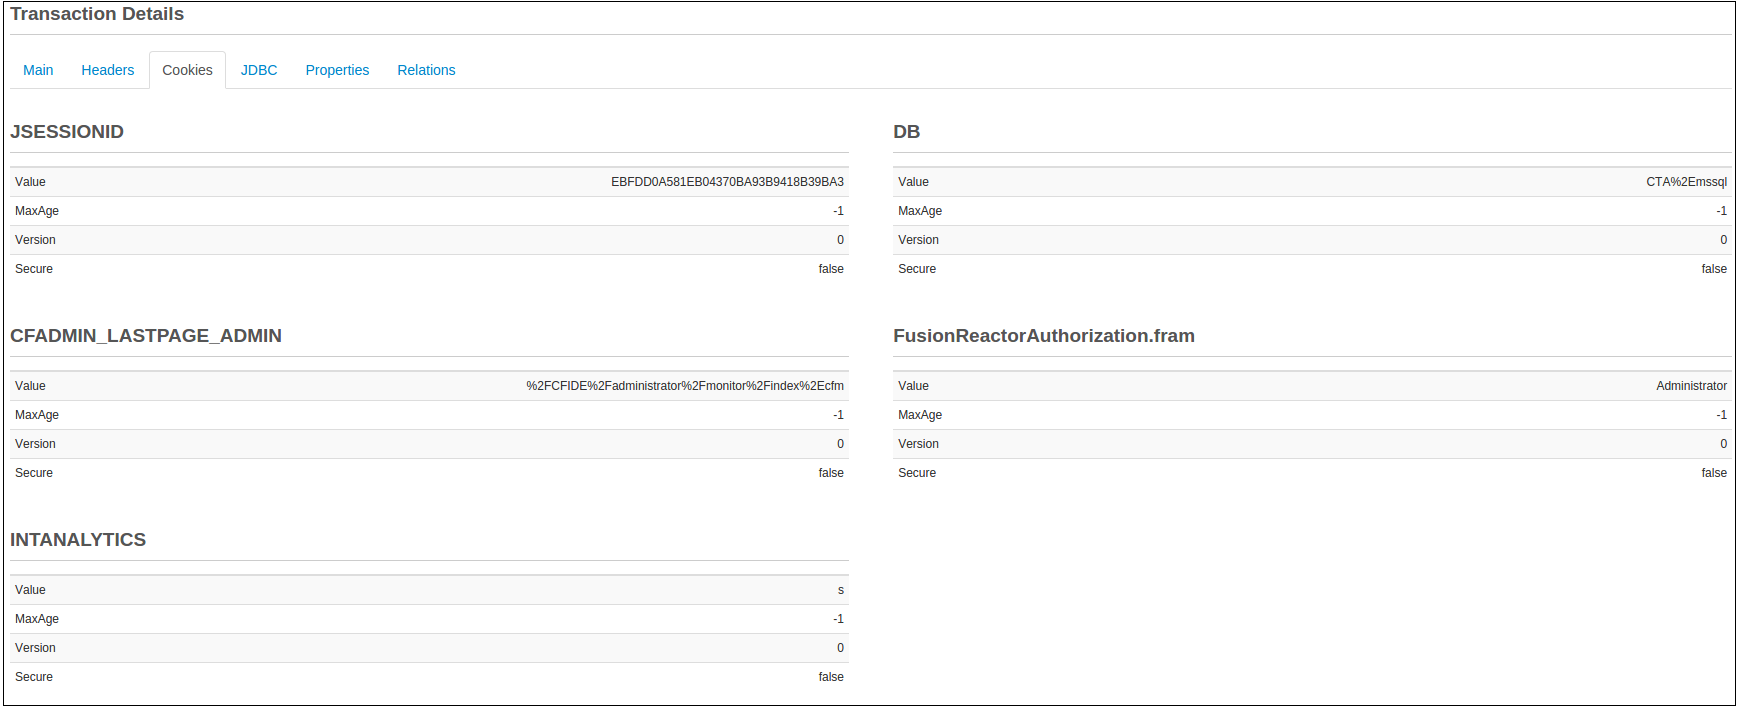
Cookies
The Cookies tab takes the Cookie string from the Headers tab and renders it in a more readable format along with other cookie information such as maximum age and whether is it secure.
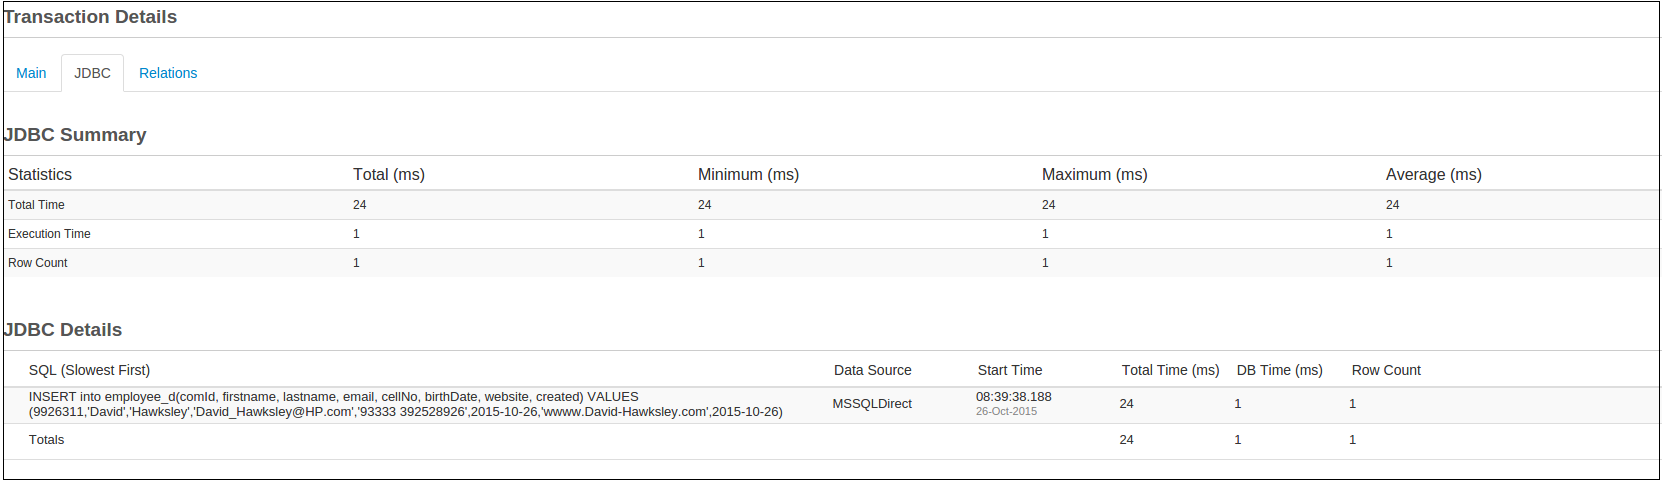
JDBC
The JDBC tab will show any queries which have been run by your page.This information is controlled by the storage strategy and other settings found on the JDBC Settings page.
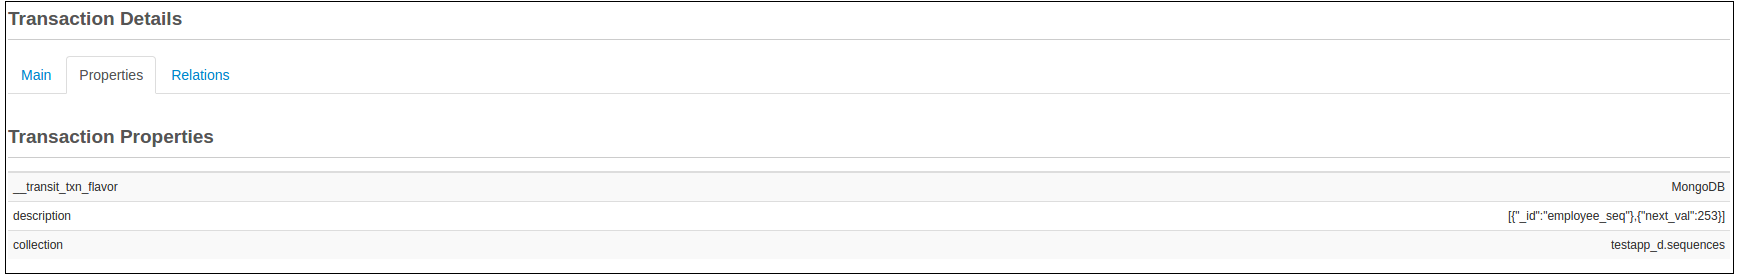
Properties
This is a visualization of the properties that are held on the request.ie description, collection, table.
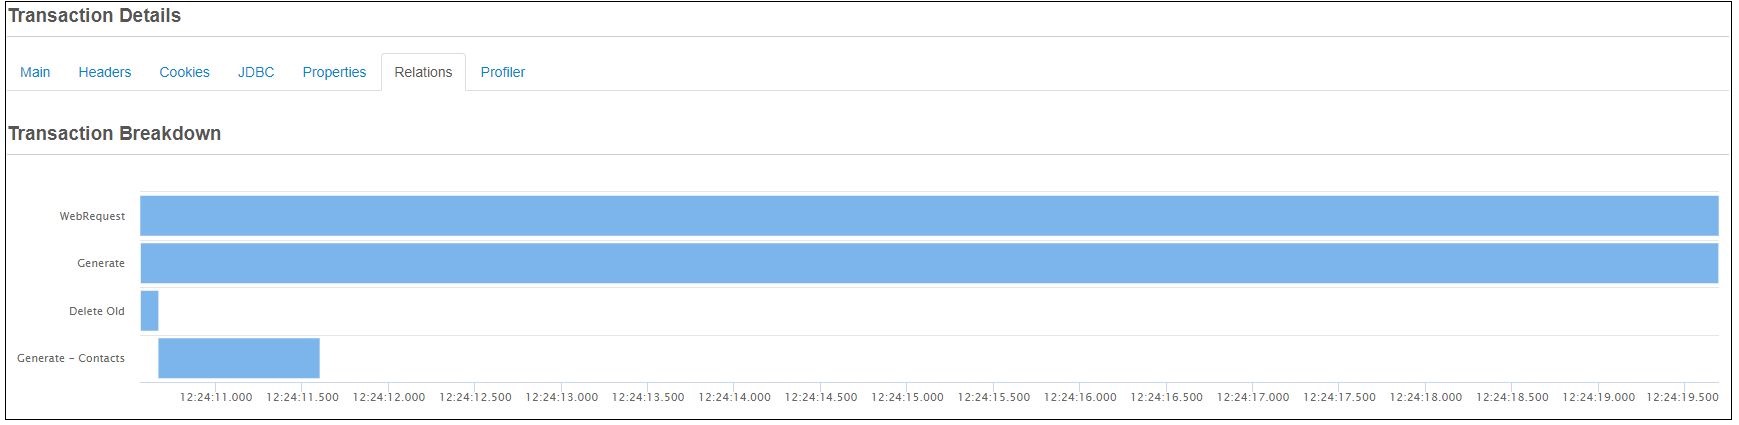
Relations
Parent and Children requests for the transaction. This tab will only appear if the selected request has a parent or child transaction.

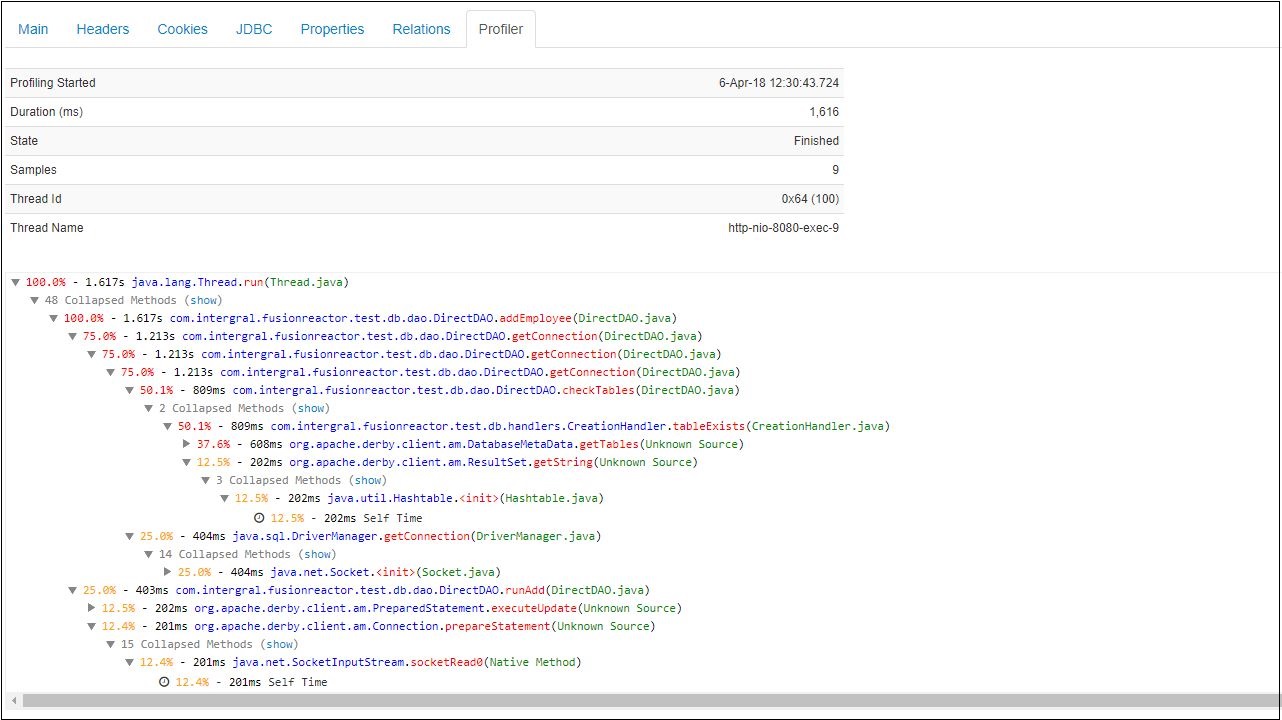
Profiler
FusionReactor Ultimate, Developer and Trial Edition includes an integrated low-overhead Java Profiler – which is the perfect tool for identifying poorly performing code in your production environment. The profiler shows the percentage and actual time spent within each method call. When the Profiler is enabled, requests and transactions will be automatically profiled and stored so you can analyze them at your leisure.
You can profile any requests or transactions which are running on the JVM – e.g. Tomcat, JBoss, WildFly, Glassfish, Jetty etc. CFML applications can also be profiled.
Tip
Click on individual classes or methods, to perform instant de-compilation
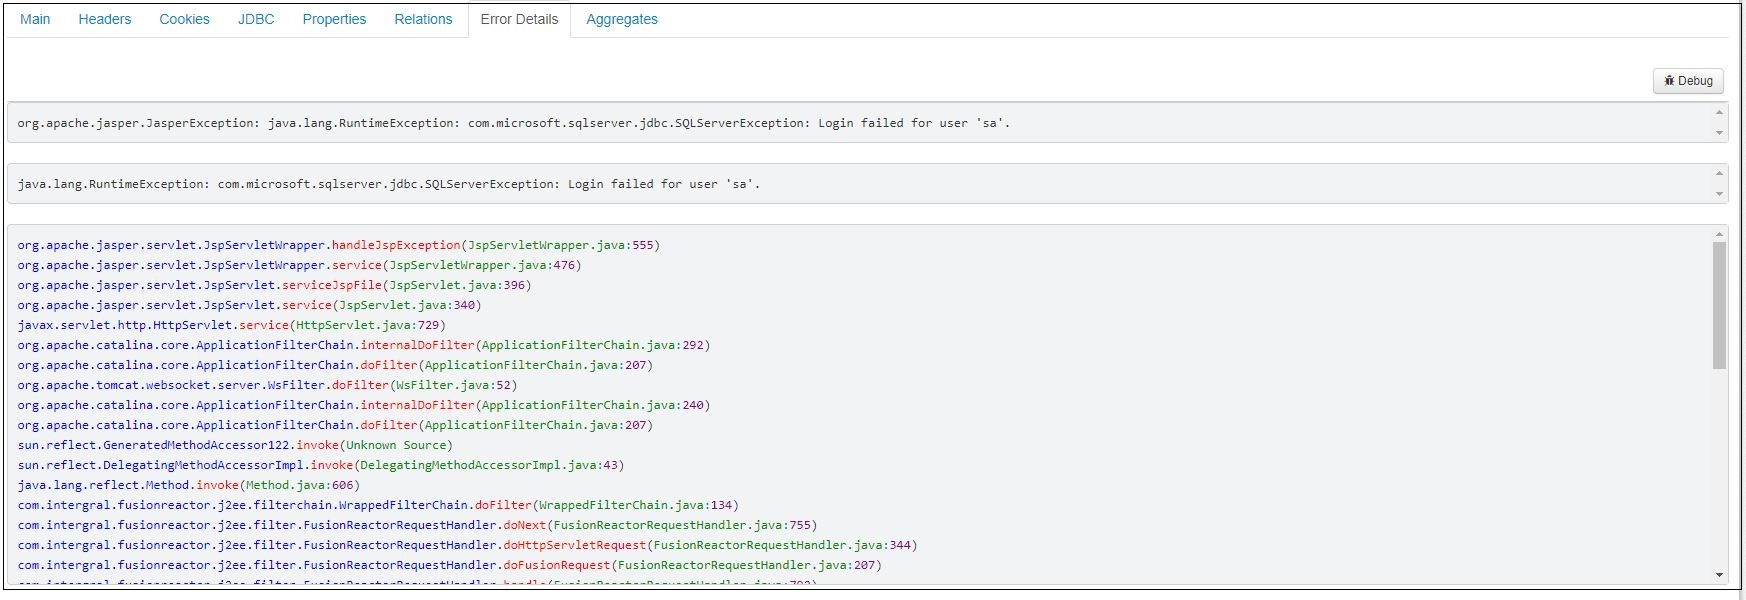
Error Details
If an error is detected, then details of this will be displayed in the Error Details tab. This will include the error exception details, as well as a stack trace of where the error happened.
Tip
Click on individual classes or methods, to perform instant de-compilation
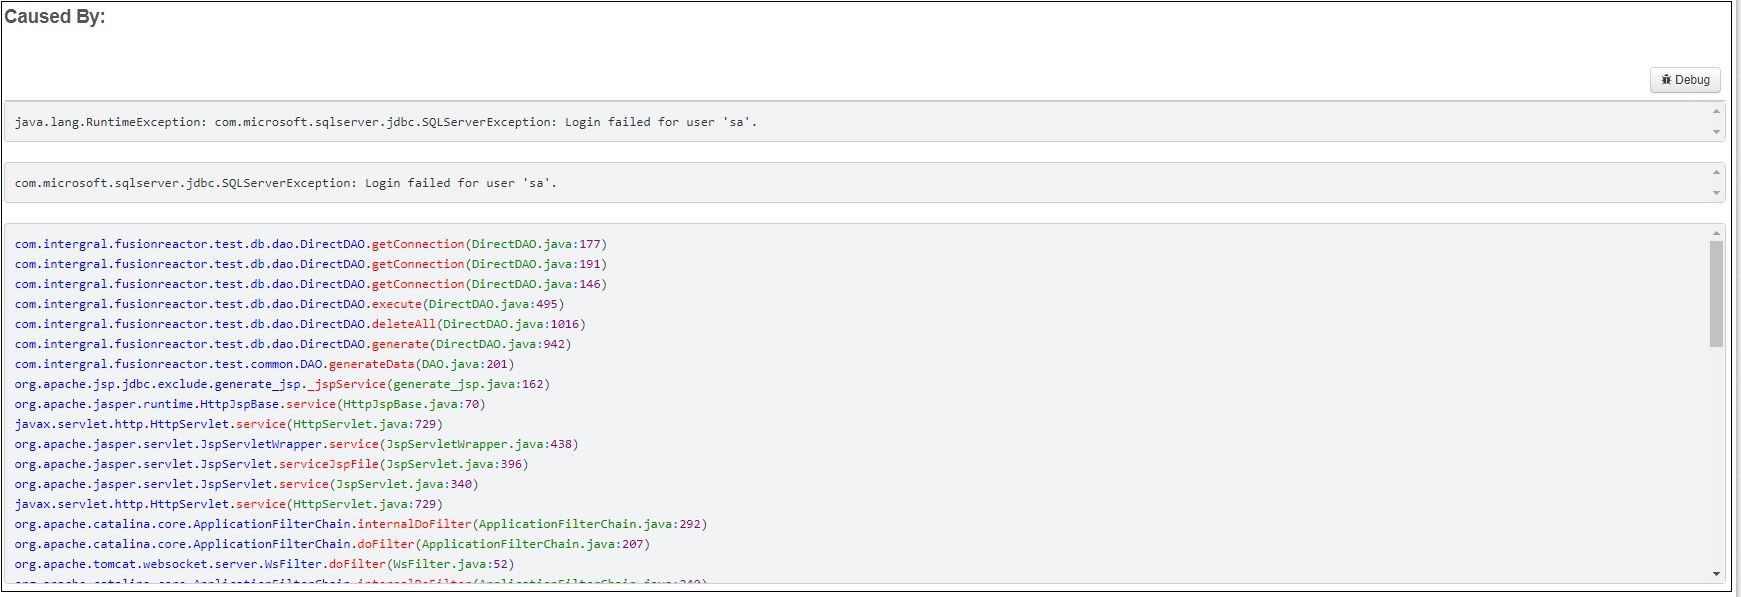
If running in a pure Java environment, scroll down the page to the Caused By area to display the stacktrace at the point that the error occurred.
Trace
The trace tab shows a stack trace of the request. Trace can be enabled in JDBC Settings.

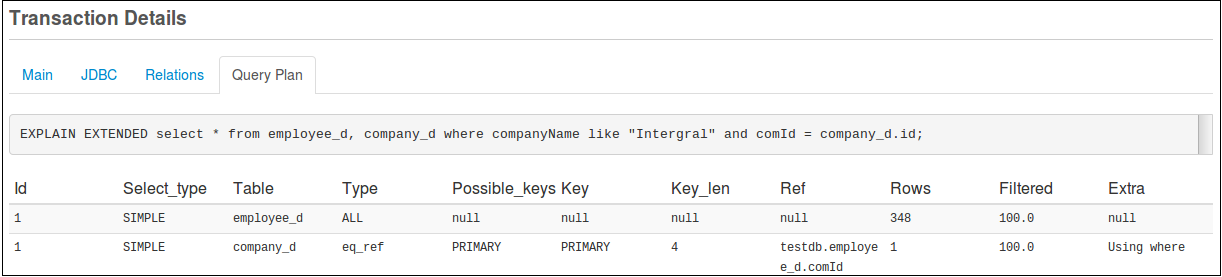
Query Plan
The query plan tab shows the result of an explain function running on the query.
Note
Not all JDBC-compliant databases support the retrieval of query plans. Examples of those that do are Microsoft SQL Server, MySQL, MariaDB,Oracle and PostgreSQL.
The following SQL statements are used depending on the database type:
- MariaDB and MySQL
- using 'EXPLAIN EXTENDED'
- PostgreSQL
- using 'EXPLAIN ANALYZE VERBOSE'
- Oracle
- using 'EXPLAIN PLAN' and DBMS_XPLAN.DISPLAY
- MS SQL Server
- using 'SET SHOWPLAN_TEXT ON/OFF'
Query Plan can be enabled in JDBC Settings.
AMF
The AMF tabs displays detailed information about any AMF data that has been used as a part of this request. This data is contributed by the FusionReactor AMF Dissector. AMF is typically used for data transfer in Flash Remoting and in Flex-based Rich Internet Applications, as well as those using Flash Remoting.
Learn more
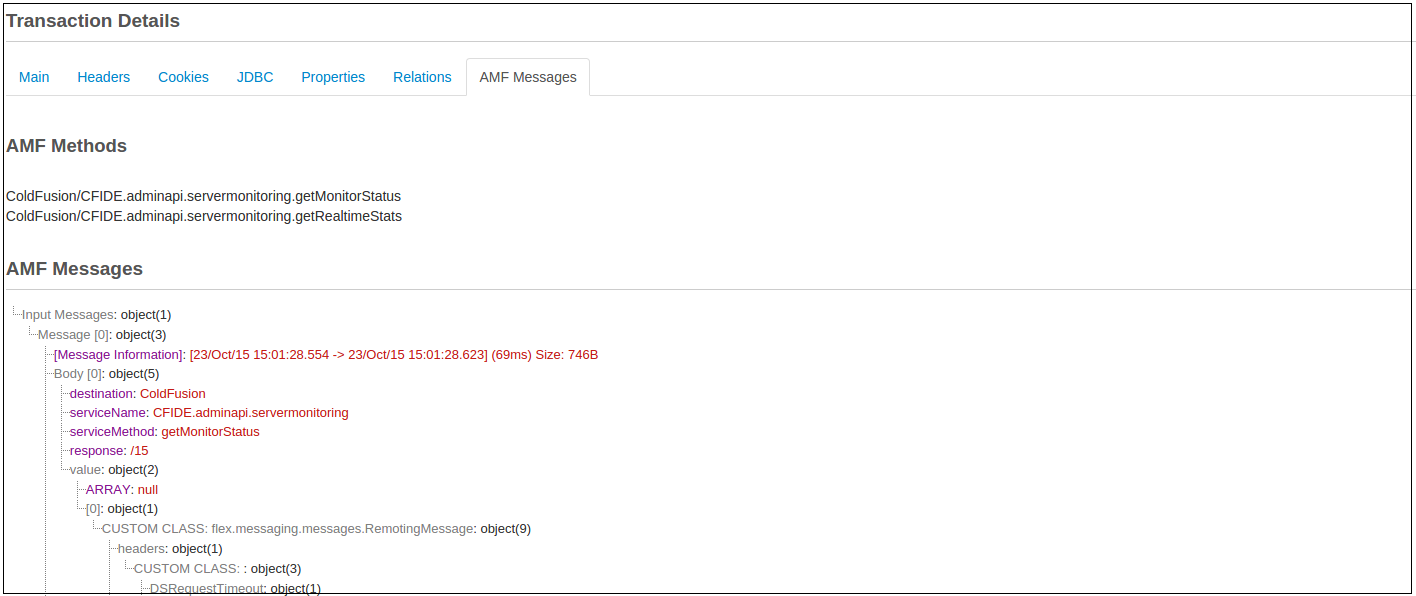
The AMF Dissector contributes a tree of information to this tab which visualizes the request and (optionally) the response message flow of the application.
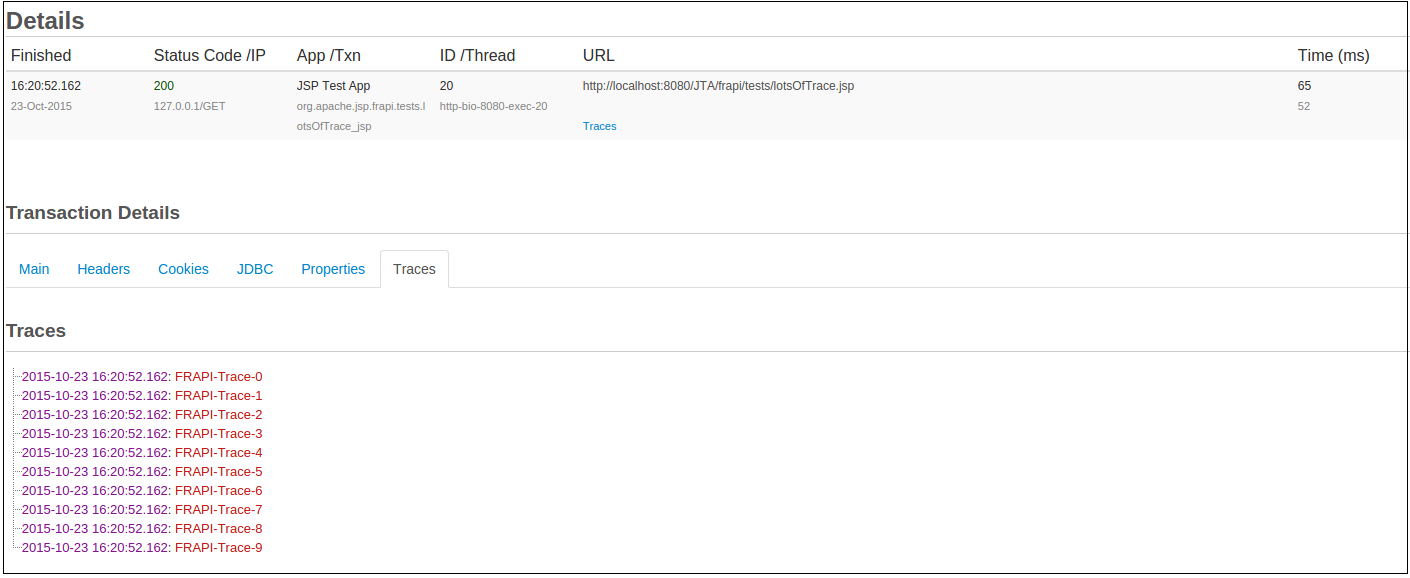
Traces
This tab displays a list of any FRAPI traces that have been placed on this transaction. These traces can be simple lists or complex maps of information.
Pages instrumented with FusionReactor's API (FRAPI) can contribute messages to this tab.
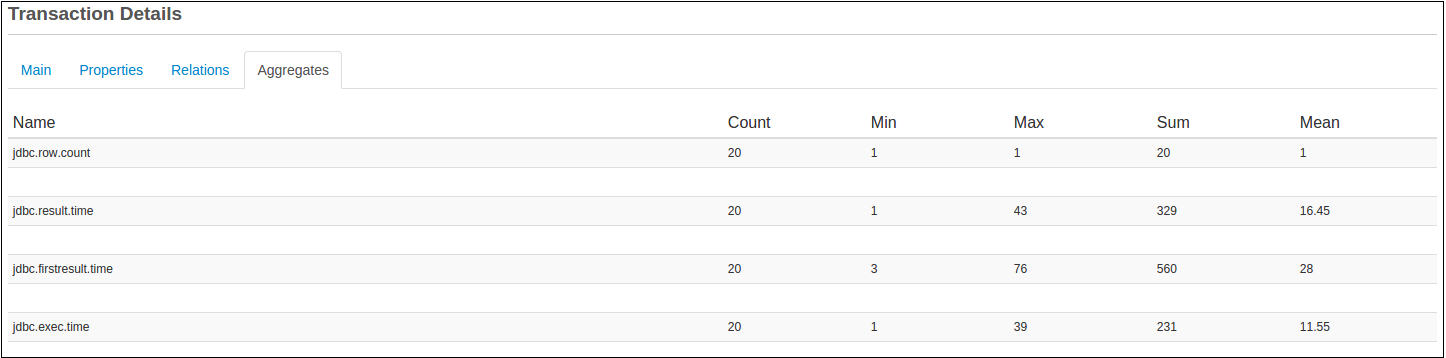
Aggregates
The Aggregates tab visualizes information contributed in aggregate to the transaction, but (usually) not stored in detail elsewhere. This data, commonly used by the JDBC subtransaction type, is rolled up and stored on the master transaction. It is usually composed of individual contributes from subtransactions.
Logging
The Logging tab displays log statements captured by the Log Tracker plugin throughout the lifetime of a transaction. This includes timestamps, logging level, the log message, and any exception that was logged.
Json Data
Learn more
Event Snapshot
Learn more
Event Snapshot page
Need more help?
Contact support in the chat bubble and let us know how we can assist.