Stack Tracing
Introduction
Stack traces provide information on the threads at a specific point in time. The top of each thread shows the header.
Video tutorial
Thread header
The header appears at the top of each stack trace for each thread. The header colors matches the thread state.
Learn more

The headers format is
1 | |
- Thread name is the verbose text name of the thread.
- Id is the unique thread id.
- STATE is the thread state as seen by the Java JVM.
- lock info shows which monitor locks the thread is currently waiting or blocking on.
Stack trace
This is shown through the various methods and code lines that have been executed. The stack trace consists of single frames and each frame shows the class, method and (if available) line number of the code which called the next frame, or in which code is currently execution.
The stack traces in FusionReactor are are displayed in two formats: Rich and Plain
-
Clicking on the blue class name opens up the decompile code for the specific class.
-
Clicking on the red method name opens up the decompile code for the method, or methods if there are more than one method with the same name, of the specific class.
-
Clicking on the green file name or line number opens up the New Breakpoint dialog with the information from the stack trace location prefilled.
With FusionReactor it is possible to decompile both Java and CFML (cfc and cfm files). If FusionReactor has access to the CFML code we will display the cfm or cfc file as it is stored on disk, however if FusionReactor has no access to the code decompiled Java code for your CFML will be displayed. Allowing FusionReactor access to the application code can be configured in Debug Sources
Debug
This is only available in FusionReactor Ultimate Edition.
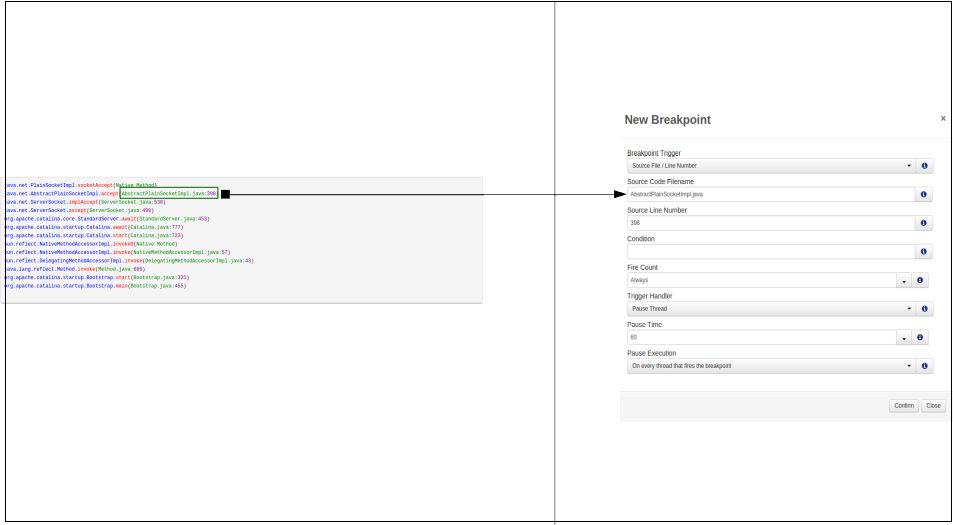
With the introduction of the Production Debugger in FusionReactor 6, Stack Traces have also been given an extra feature to create breakpoints directly for a source file by clicking on it in the Stack Trace:
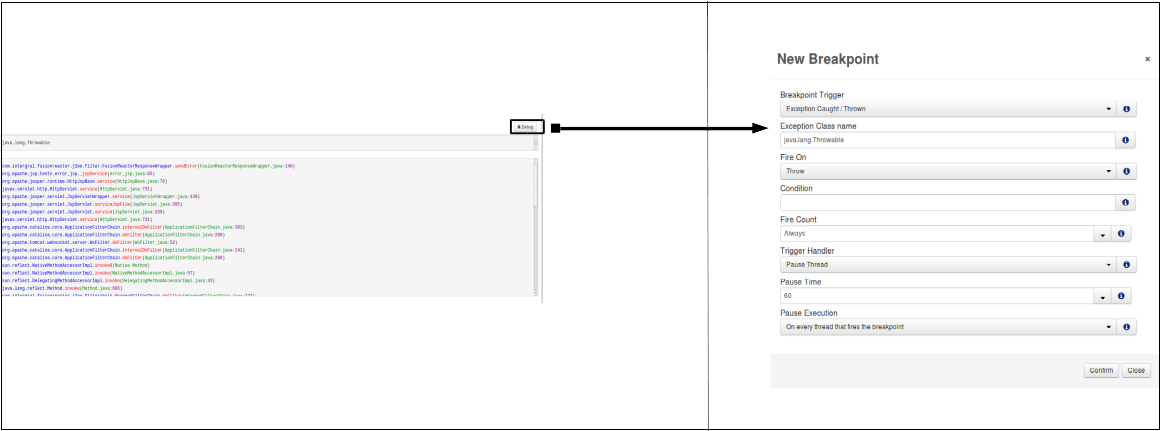
It is also possible to create a trigger directly for a Request that failed due to an Exception, from the Request Detail page:
Learn more
Locks
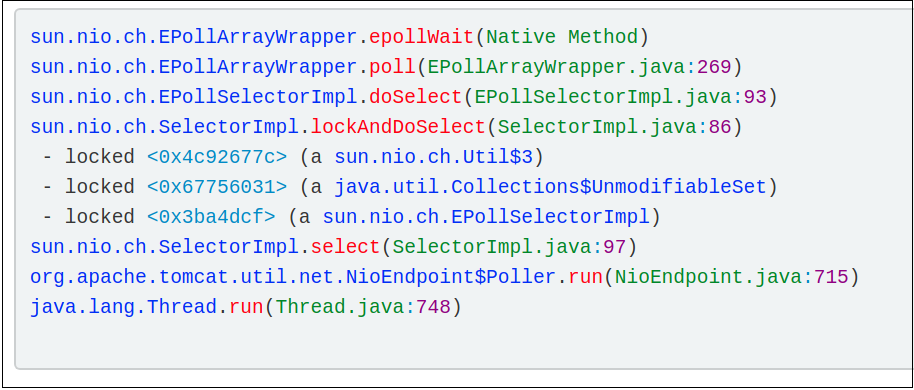
Locks are best explained by an example. Imagine 2 threads, Thread "http-nio-8080-exec-6" with ID 81 and another thread "http-nio-8080-exec-7" with ID 82. If thread 81 acquires a lock (of type java.lang.Object and hash code 0x77a224c4) which thread 82 also needs, thread 82 will have to wait thread 81 to release it.
Thread 81 will have the following shown in the stack trace at the location where its acquired the lock.
1 | |
Where Thread 82 needs to use the lock and waits for it to be released from thread 81 it shows the following in the stack trace
1 | |
Locked
Locked means that the thread has ownership of the object with hash code 0x77a224c4, in this case a java.lang.Object. While this thread owns the lock, no other thread can have it, blocking them from entering this portion of code (often a function).
Waiting on
Waiting means that the thread is waiting for the object with hash code 0x77a224c4, in this case a java.lang.Object.
Lock filter
By clicking on a lock link, the page is redirected to the Stack Trace All Threads and a filter is applied so that only threads that have either acquired or are waiting on a chosen lock are shown. A banner is displayed at the top of the page to show this.
Example
A lock link is shown below:

Info
Lock links are available from any page showing locks (Stack Traces, Debug Frames, Profiles).

Thread / Transaction table
For each thread, along with the stack traces in FusionReactor, are the thread details. The thread details table shows information about the thread as well as some limited information about the active request.
Example
A blocked thread running the synchronised_released.jsp test page.
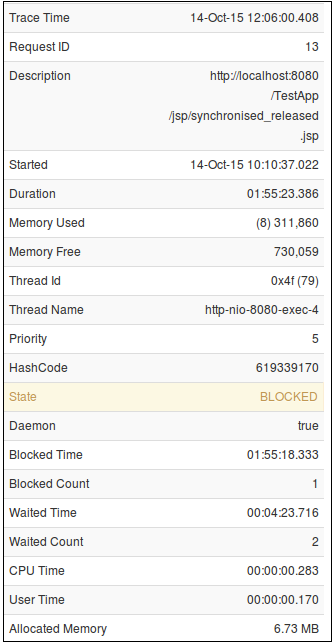
The table shows the following information:
| Column Name | Description of the value |
|---|---|
| Trace Time | The time the stack trace was generated |
| Request ID | The request ID if the active request (if one is active for the thread) |
| Description | The description from the active request (if one is active for the thread) |
| Started | The start time of the active request (if one is active for the thread) |
| Duration | The current duration of the active request (if one is active for the thread) |
| Memory Used | The memory used by the JVM when the active request started. (if one is active for the thread) |
| Memory Free | The memory free in the JVM when the active request started. (if one is active for the thread) |
| Thread ID | The unique thread ID. |
| Thread Name | The nice thread name. |
| Priority | The priority of the thread, between 10 (MAX_PRIORITY) and 1 (MIN_PRIORITY). |
| HashCode | The hash code for this thread. |
| State | The state of the thread. |
| Daemon | Whether this thread is a daemon thread or not. |
| Blocked Time | The amount of time that this thread has been in state BLOCKED since the JVM started. |
| Blocked Count | The number of times that this thread entered state BLOCKED since the JVM started. |
| Waited Time | The amount of time that this thread has been in state WAITING / TIME_WAITING since the JVM started. |
| Waited Count | The number of times that this thread entered state WAITING / TIME_WAITING since the JVM started. |
| CPU Time | The total CPU time for this thread since the JVM started. |
| User Time | The total user CPU time for this thread since the JVM started. |
| Allocated Memory | The total number of bytes that have been allocated by this thread since the JVM started. (Available for Java 1.7 and above) |
Need more help?
Contact support in the chat bubble and let us know how we can assist.