CPU Graph
The CPU Graph page show you a graph of samples currently stored in memory by FusionReactor. The graph displays the current load of the CPU consumed by the server and the JVM instance.
The CPU graph allows you to see if the CPU is particularly busy with J2EE or other work, as an aid to troubleshooting performance issues.
Several time spans are available, with differing resolutions. These will be filled as data points that are collected by FusionReactor.
Each time varying graphs show two independent values overlaid :
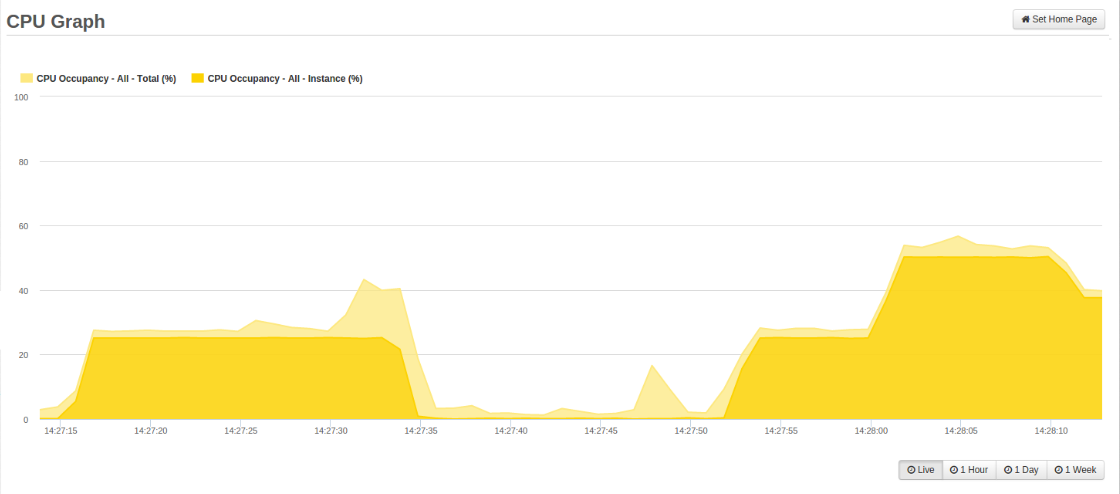
CPU Occupancy - All - Total (%): Light yellow
- The total CPU usage across all cores.
CPU Occupancy - All - Instance (%): Yellow
- The CPU usage for the JVM across all cores.
To deselect and reselect each independent value, simply click on their respective names. When a value is deselected (greyed out) then that value is no longer displayed on the activity graph.
Placing your mouse pointer on a data point within the graph shows a tool-tip with details about that sample, including:
- Date and time of the request
- CPU Occupancy - All - Total (%)
- CPU Occupancy - All - Instance (%)
When browsing the 1 Hour, 1 Day, and 1 Week activity graphs you're able to select time frames by using the slider under the graph.
Need more help?
Contact support in the chat bubble and let us know how we can assist.