Thread Visualizer
The Thread Visualizer page shows all threads within the Java Virtual Machine (JVM) for this server. Each color represents the state the thread was in when the data was updated.

The Thread Visualizer page is session based. As soon as the browser tab is closed or refreshed the data will be lost and the graph will restart.
Searching
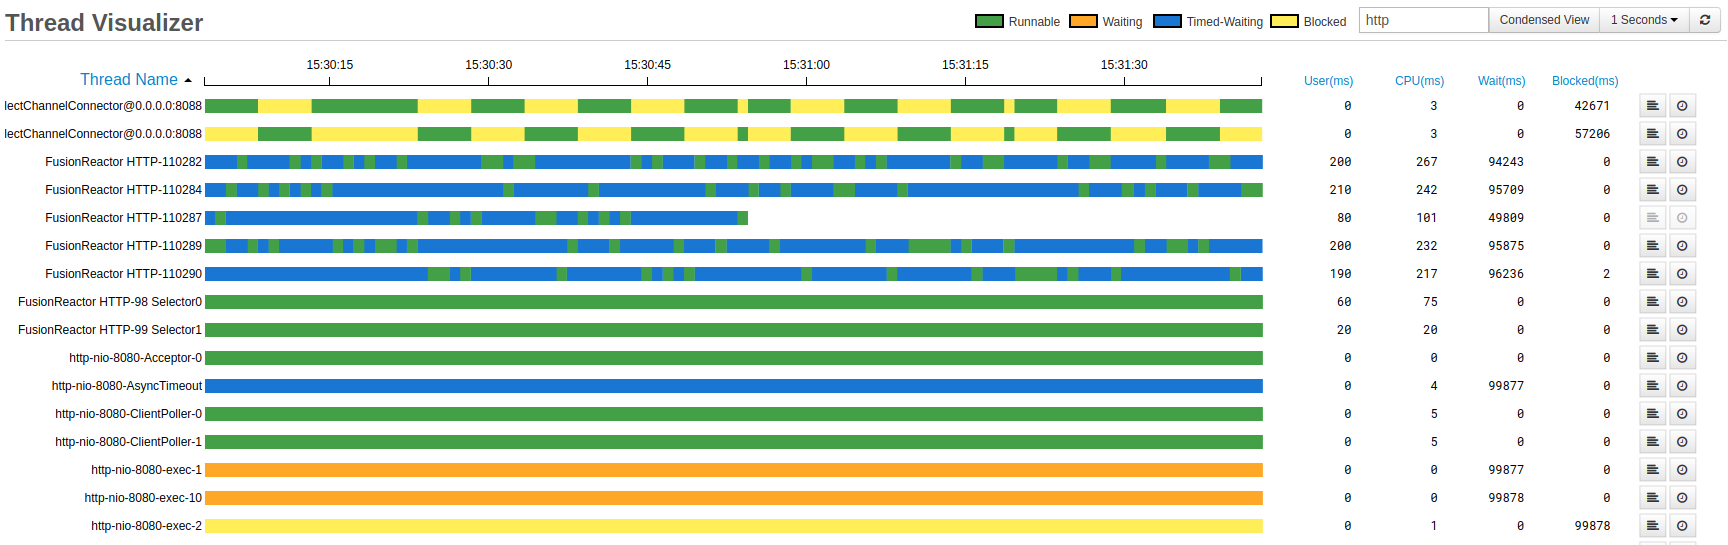

The search bar allows the user to filter the threads shown based on if the thread name contains the characters in the search.
In the image to the right, the user has inputted "http" into the search bar. Any thread names containing "http" will be shown along with their table elements.
The graph still retains the ability to perform sorts, stack traces and profiles on the filtered threads.
Clearing the search bar removes the filter and all threads will be displayed.
Sorting


Threads in the Thread Visualizer page by five categories both ascending and descending:
| Name | Description |
|---|---|
| Thread Name | The name of the thread given as a string. |
| User Time (milliseconds) | The user-level CPU time for the specified thread. |
| CPU Time (milliseconds) | The total CPU time for a specified thread. |
| Wait Time (milliseconds) | Total time a thread has been waiting (including timed) for another thread to perform a particular action. |
| Blocked Time (milliseconds) | Total time a thread is blocked waiting for a monitor lock. |
To perform a sort, click any blue text. A caret will appear to indicate whether you are sorting by ascending or descending.
Condensed View
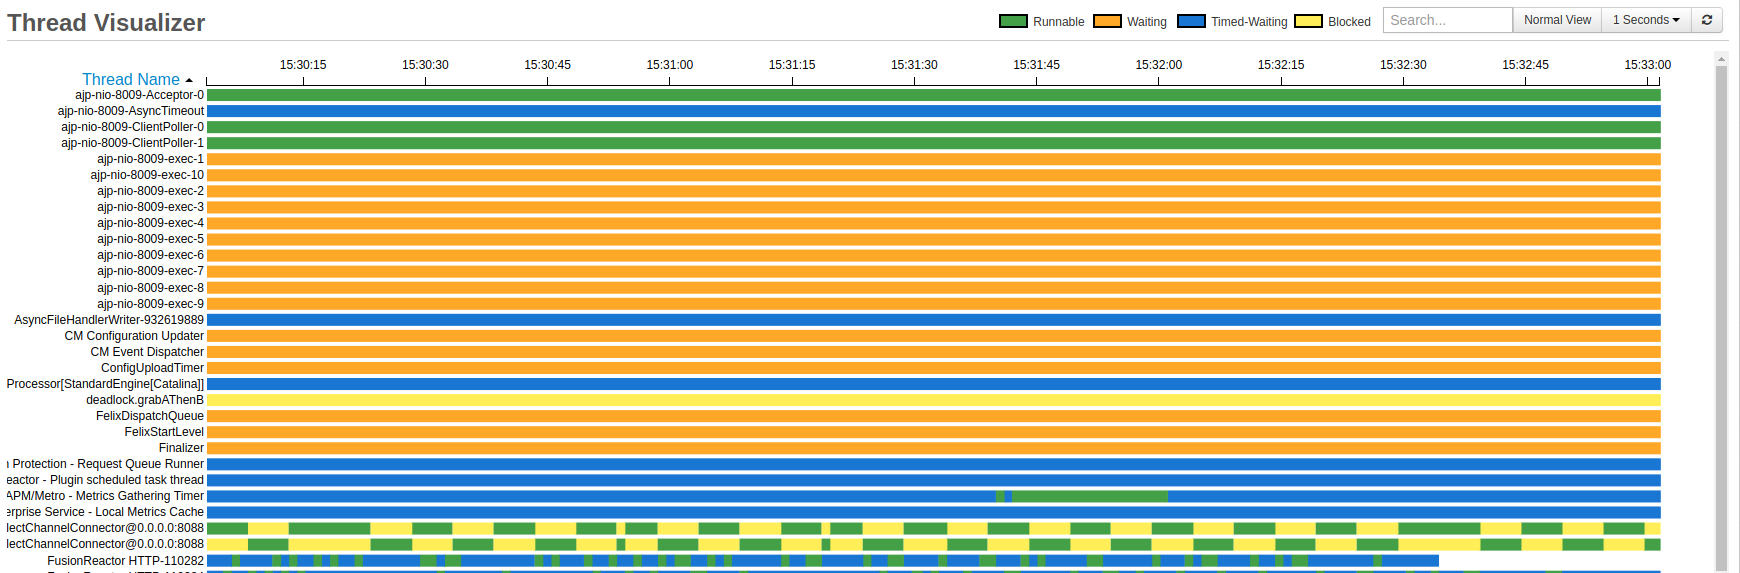

Condensed view allows the user to view more threads in the same amount of space by hiding the table and making the size of threads smaller.
The user retains the ability to search thread names to filter threads.
To activate this mode, click the Condensed view button located at the top right of the screen, next to the search bar.
Navigation
 )
)
 )
)
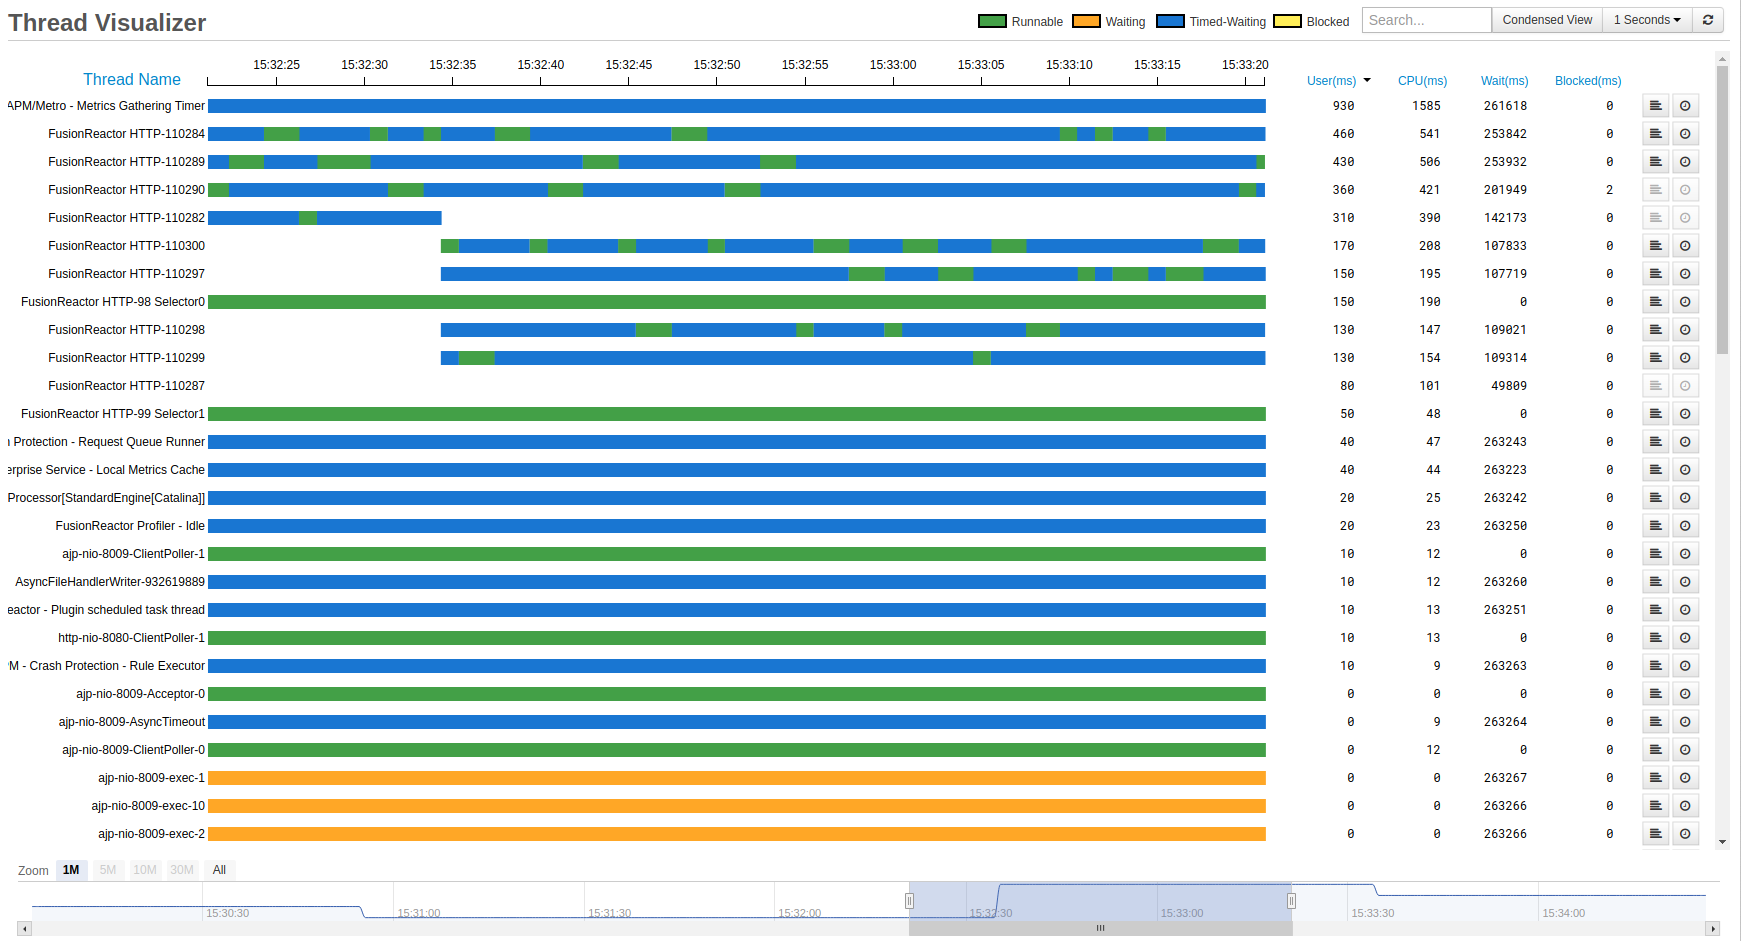
The navigation bar allows the user to change the time domain of the graph. This means the user can go backwards and forwards in time and see what state a thread was in at a specific time.
This can be useful if the user sees a thread is in a state they don't expect.
Example
If a thread has changed to a blocked state, the navigator can be used to change the time domain to when this state was changed. This allows the user to see what state the other threads were in and if a change in another threads state may of caused it.
In the example above I have used the selection button "1M" to change time time domain to the last minute of data.
The graph will store the last 31 minutes of data, any threads that have had no data on the chart for the last 31 minutes will be removed.
The line chart on the navigation bar represents how many threads the graph received data from in that particular update.
Stacktracing and Profiling
| Button | Description |
|---|---|
Stack trace:  |
Opens a stacktrace of the thread the button is associated with in a new window. |
Start Profile:  |
Starts a profile of the thread the button is associated with. Will then change to the stop profile button while the thread is profiling. |
Stop Profile:  |
Stops a profile of the thread the button is associated with. Will then return to the start profile button. |
Info
Buttons are disabled when a thread cannot be stack traced or profiled. Disabled buttons are grayed out.
Thread-Key
| Thread State | Description |
|---|---|
Runnable  |
A thread which is ready to execute, or is actually executing in the Java virtual machine is in this state. |
Waiting  |
A thread that is waiting indefinitely for another thread to perform a particular action is in this state. This state corresponds to an Object Wait/Notify condition becoming satisfied. These conditions are often used to signal explicit interprocess communication, and java Lock semantics. |
Timed-Waiting  |
A thread that is waiting for another thread to perform an action (with explicit timeout) is in this state. |
Blocked  |
A thread in this state indicates it is waiting for a monitor to become free, but FusionReactor has calculated this will never occur due to the state of one or more other threads. |
Learn more
Need more help?
Contact support in the chat bubble and let us know how we can assist.