Enterprise Dashboard
With FusionReactor Enterprise Edition, you have the ability to monitor more than one server instances easily with the use of the Enterprise Dashboard. Any FusionReactor Enterprise Edition installation is able to report the state of the server remotely to any other FusionReactor Enterprise Edition server.
The Enterprise Dashboard lets you track the state of installations on one or more servers from a single window. You immediately see the state of memory, CPU, DB load and average request time, in an easy to read graphical dashboard display.
Using the Ephemeral Data Service you also have the ability to proxy the FusionReactor user interface, allowing you to access the local FusionReactor instance without having an exposed port.
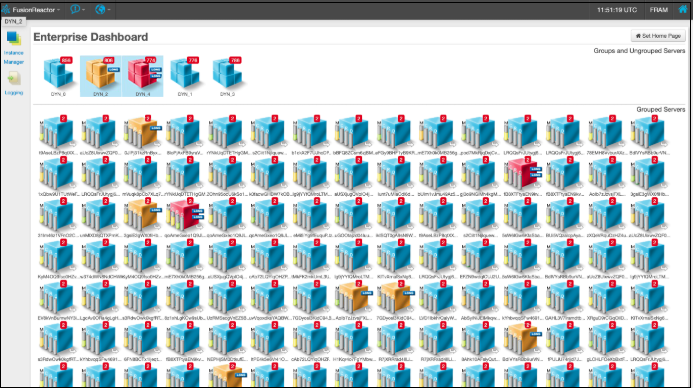
Once you have your machines set up, go to the dashboard. The default view when bringing up the Enterprise Dashboard is to show all groups along with any servers which are currently ungrouped.
Servers & groups
The Enterprise Dashboard contains either grouped or ungrouped instances of FusionReactor. These instances can be from any server with FusionReactor installed, providing the instances have an active trial, Enterprise, Developer or Ultimate license.
Group information
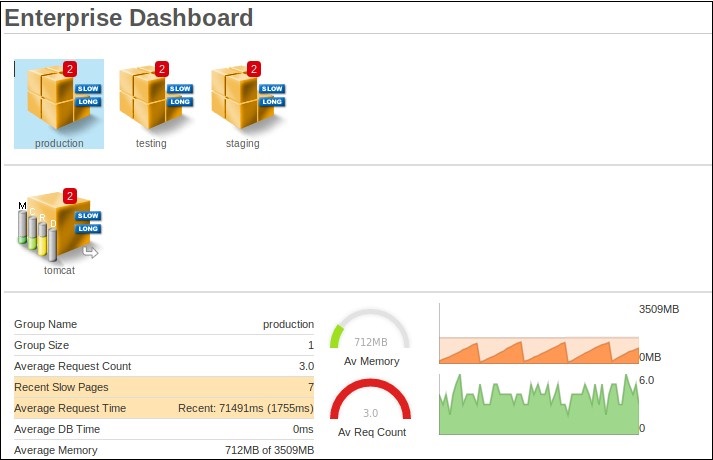
The group information pane shows you how many servers are within this group as well as showing statistics for all grouped servers. These statistics are:
| Name | Description |
|---|---|
| Group Size | This shows the number of servers within this group. |
| Request Count | This shows you how many requests are running on all grouped servers along with the total number of requests which have been run. |
| Recent Slow Pages | This shows how many requests within the last 60 seconds have run longer than the Slow Page Threshold value. |
| Average Request Time | This is the average request time for all grouped servers for the last 60 seconds, and for the complete history size. |
| Average DB Time | This is the average time spent on database operations for all grouped servers. |
| Average Memory | This is the average used and total allocated memory for all grouped servers. |
Additionally, you will see two graphs (Average Used Memory and Average Request Count.) These graphs show the same information displayed in the statistics section but they are presented visually for ease of use.
Server information
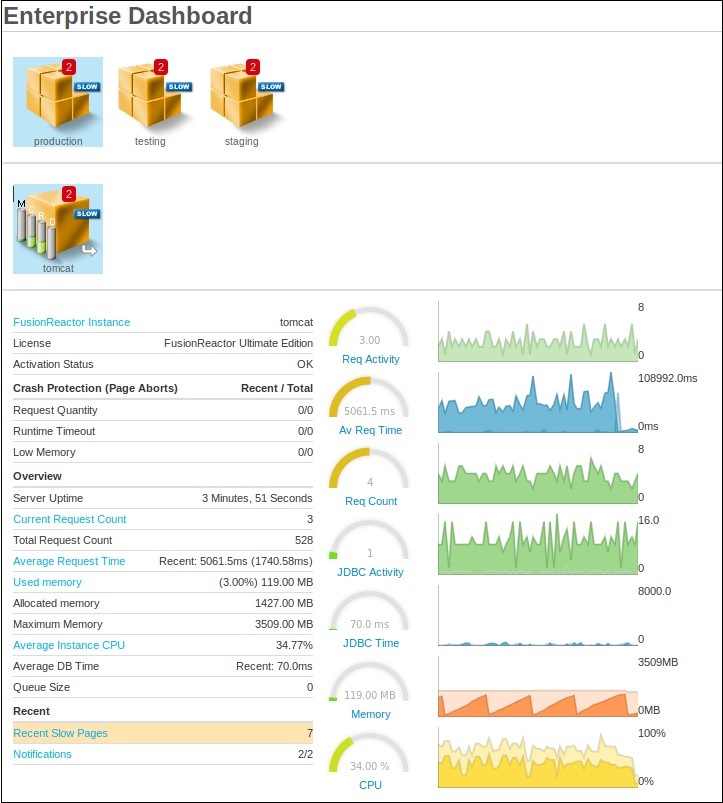
The server information pane shows you various statistics about your selected server. Statistics which are listed with blue titles are links.
Tip
Click on one of these titles to be taken to a more detailed page within the instance of FusionReactor running on that server.
If a server is currently having problems then the appropriate statistic is highlighted to indicate where the problem is. The displayed statistics are:
| Name | Description |
|---|---|
| FusionReactor Instance | This is the full ID of the instance of FusionReactor running on this server. |
| License | This shows the type of FusionReactor license running on this server. |
| Activation Status | This shows you if the license on this machine has been activated or not. |
Overview
| Name | Description |
|---|---|
| Server Uptime | This shows how long this server has been up. |
| Current Request Count | This is the number of requests currently running on this server. |
| Total Request Count | This is the total number of requests which have run on this server. |
| Average Request Time | This shows the average request time on this server over the last 60 seconds, and for the complete duration of it's request history. |
| Used Memory | This is the amount of memory currently used by this server (not the amount currently allocated). |
| Allocated Memory | This is the amount of memory that has been allocated to the server. |
| Maximum Memory | This is the total memory that the server has. |
| Average Instance CPU | This shows the amount of CPU time used by this instance since the last CPU value was measured. It is expressed as a percentage of the total CPU time (across all CPU cores) that was available during that period. |
| Average DB Time | This shows the amount of time spent on database operations on this server. |
| Queue Size | This is the number of requests currently queued due to Crash Protection. |
Crash Protection (Page Aborts)
| Name | Description |
|---|---|
| Request Quantity | This shows the number of pages which triggered Crash Protection due to request quantity in the last 60 seconds and in total. |
| Runtime Timeout | This shows the number of pages which triggered Crash Protection due to runtime timeout in the last 60 seconds and in total. |
| Low Memory | This shows the number of pages which triggered Crash Protection due to low memory in the last 60 seconds and in total. |
Recent
| Name | Description |
|---|---|
| Recent Slow Pages | This shows how many requests within the last 60 seconds have run longer than the Slow Page Threshold value. |
| Notifications | This shows the total and number of unread notifications on the server. |
Additionally, you will see seven graphs (Req Activity, Av Request Time, Req Count, JDBC Activity, JDBC Time, Memory and CPU).
These graphs show the same information displayed in the statistics section but they are presented visually for ease of use. All graphs (except Req Count) have an arrow on the top right of them.
Tip
Click the arrow to view a more detailed graph with additional functionality (time lines) within the instance of FusionReactor which is running on this server.
Manage servers
Upon upgrade, only FusionReactor 8.8.0 dashboards can monitor 8.8.0 instances
- If the password of the admin user is changed, it will no longer be managed by an instance running an older version of FusionReactor.
- To increase the changes of a successful connection, ensure that the server you wish to add to the Enterprise Dashboard is online.
Note
You can add an 8.7.7 instance and below to an 8.8.0 dashboard, but you cannot add an 8.8.0 instance to an 8.7.7 and below dashboard.
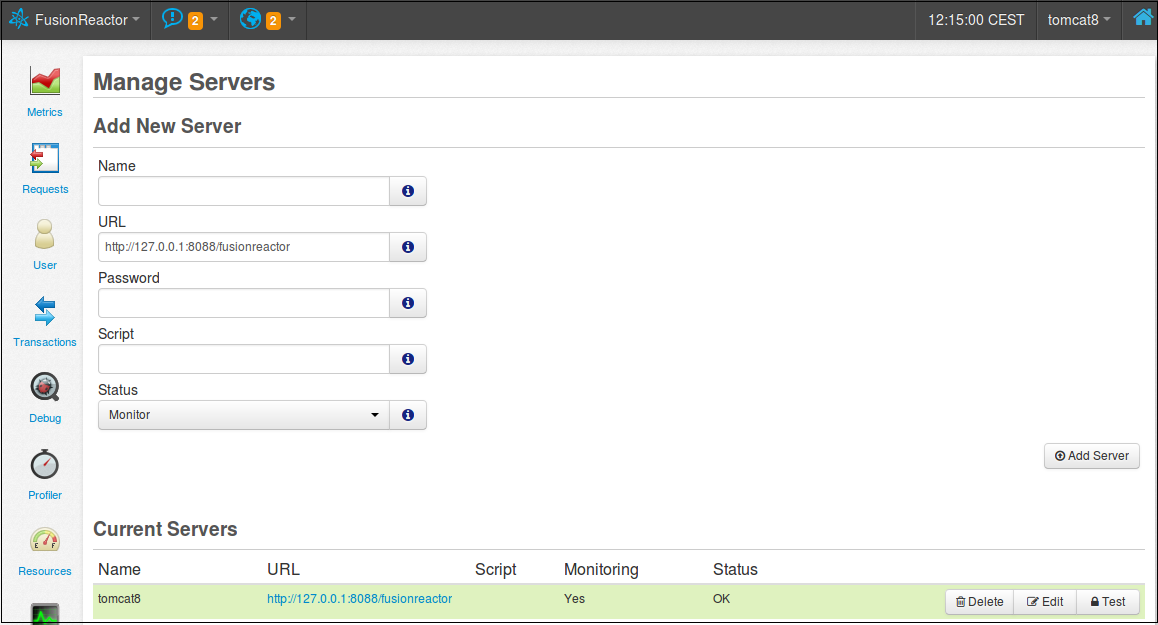
Add a new server
When you access FRAM, navigate to Manage Server.
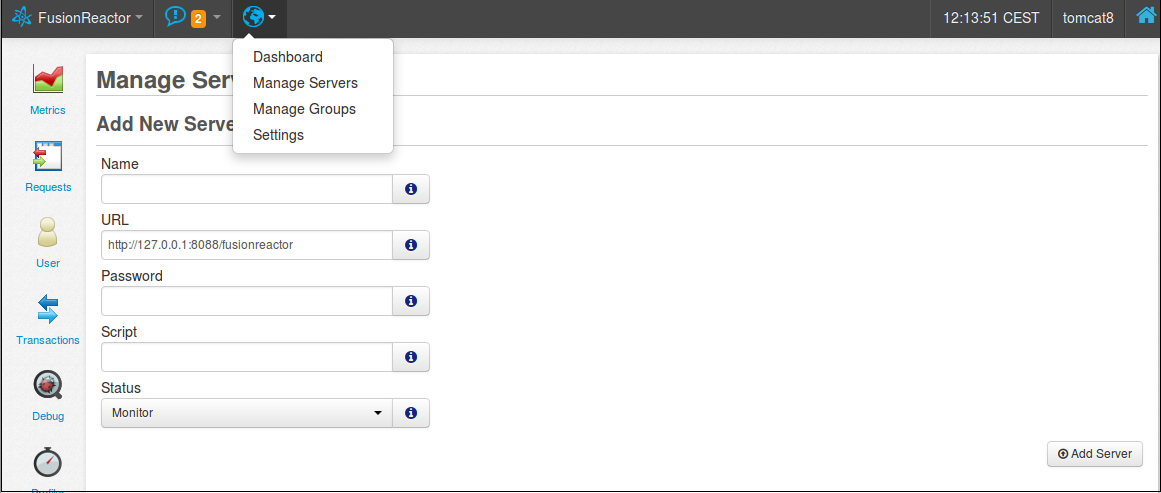
From this screen you can add new servers to the Enterprise Dashboard or manage existing servers.
The form to add a new server has the following fields:
| Name | This is the name which will appear in the Enterprise Dashboard under your server icon. |
| URL | This is the location of FusionReactor on the target server. An example URL will look something like this: http://127.0.0.1:8088/fusionreactor |
| Password | This is the password of FusionReactor on the target server. |
| Script | If you specify the path to a script on your server then it will be called when the server goes down or comes up. See the script section below for more information or check out Manage Servers |
| Status | Choose if this new server is online or offline. An online server collects statistics and displays them in the Enterprise Dashboard. Warnings will alert to any problems. If a machine is offline then no information will be gathered and the icon will be gray. When adding a server which is currently turned off, set it's status to offline. Change its status later by returning to the Manage Servers page (clicking the green button) or by clicking the status button (top right hand corner of a server icon) directly within the Enterprise Dashboard. |
| Groups | Any groups set up are listed here. Simply select which groups you want this new server to appear within. Add new groups at any time from the Manage Servers page. |
Once you click Add Server your new server will be listed at the bottom of the page (Current Servers) along with its current connect status.
Example
Add an external server in the Enterprise Dashboard
This section, will provide a simple example of adding an external FusionReactor instance in the Enterprise Dashboard. For this example, an Amazon EC2 instance was used.
Navigate to the Manage Servers tab and add all the details of the external server as described in the section above.
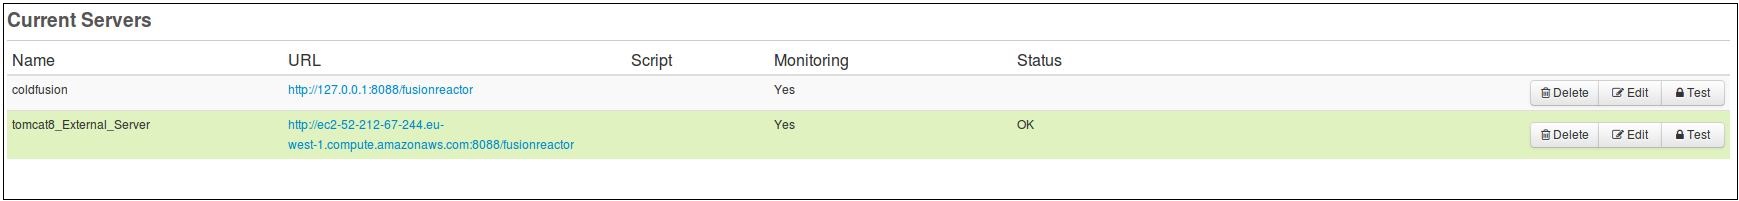
From the screenshot above, we see that the Status code of the FusionReactor instance with name "tomcat8_External_Server" is set to OK. That means, that you should be able to access the FusionReactor instance externally.
The next step is to access the Enterprise Dashboard. Here, you should be able to see the new FusionReactor instance as in the screenshot below:
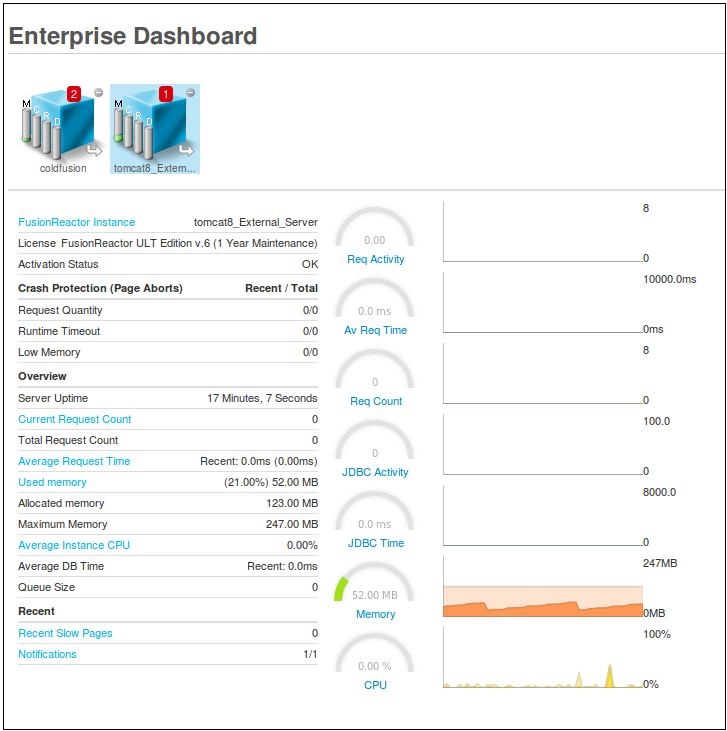
Now, you are able to monitor the external server with FusionReactor.
Managing existing servers
Below the Add Server form you will see a list of all servers currently available in the Enterprise Dashboard.
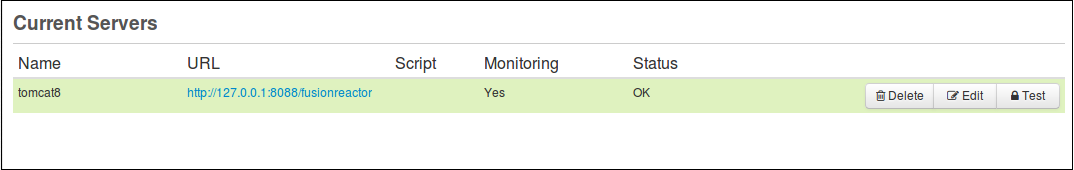
Each server has three buttons next to it:
| Delete | Clicking on this button will remove the server from this Enterprise Dashboard. |
| Edit | Clicking on this icon will take you to the Modify Server page. From this page you can change any of the information which is listed above. |
| Test | Clicking on this icon will check the connect status for a server. The screen will be refreshed and you will see a message telling you if there were any problems trying to access FusionReactor on this server. |
Clicking on the URL for any server in the Existing Servers list will take you directly to the instance of FusionReactor which is running on that server.
Shutdown / Startup script
The script file which you can associate with a server will get called whenever that server goes down or comes back up again. It takes 5 parameters, they are:
| Status | This parameter will have the value DOWN or UP which correlates to the status of the server. |
| InstanceName | This is the instance name of the server in question (as defined on the Manage Servers page.) |
| InstanceIP | This is the IP address of the server in question. |
| PID | The Process ID of the server. You could use this in order to terminate a server which had stopped responding. (If the PID is unknown then a value of -1 will be passed.) |
| LastSeen (ms) | This is the last time (expressed in milliseconds) that the server was last successfully contacted. |
Manage groups
Add a group
The process of creating a group is very simple. First, you need to navigate through the Manage Groups page.
Example
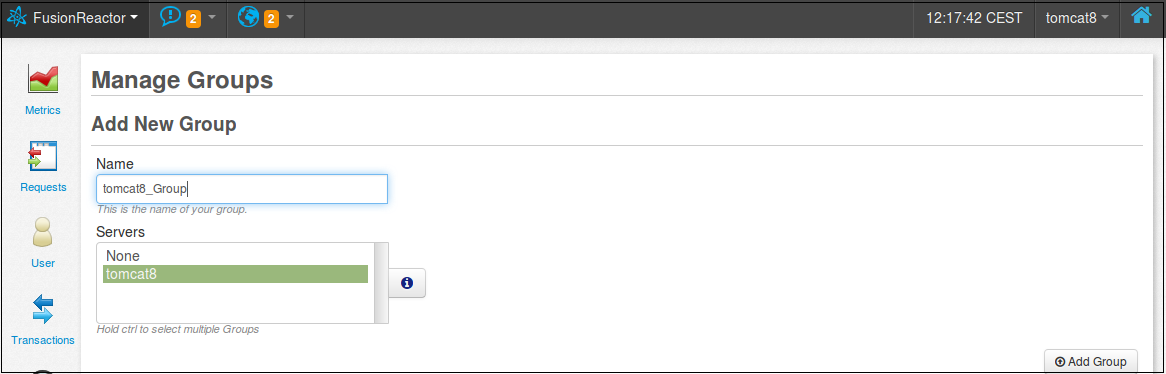
When you access the page, you will see the following fields.
| Name | This is the name of your new group which will appear in the Enterprise Dashboard and on the Manager Servers screen. |
| Servers | If you have any servers currently set up then they will be listed here. Simply select which servers should be added to your new group. |
When the new group has been created, you will be able to see that under the Current Server Groups area.
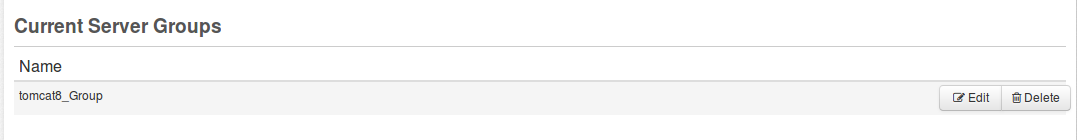
Manage existing groups
Each group has two buttons next to it:
| Edit | Click this button to change a group name or to change the servers which are currently a part of this group. |
| Delete | Clicking on this button will prompt you if you are sure. OK the dialog box to delete the group and refresh the page. |
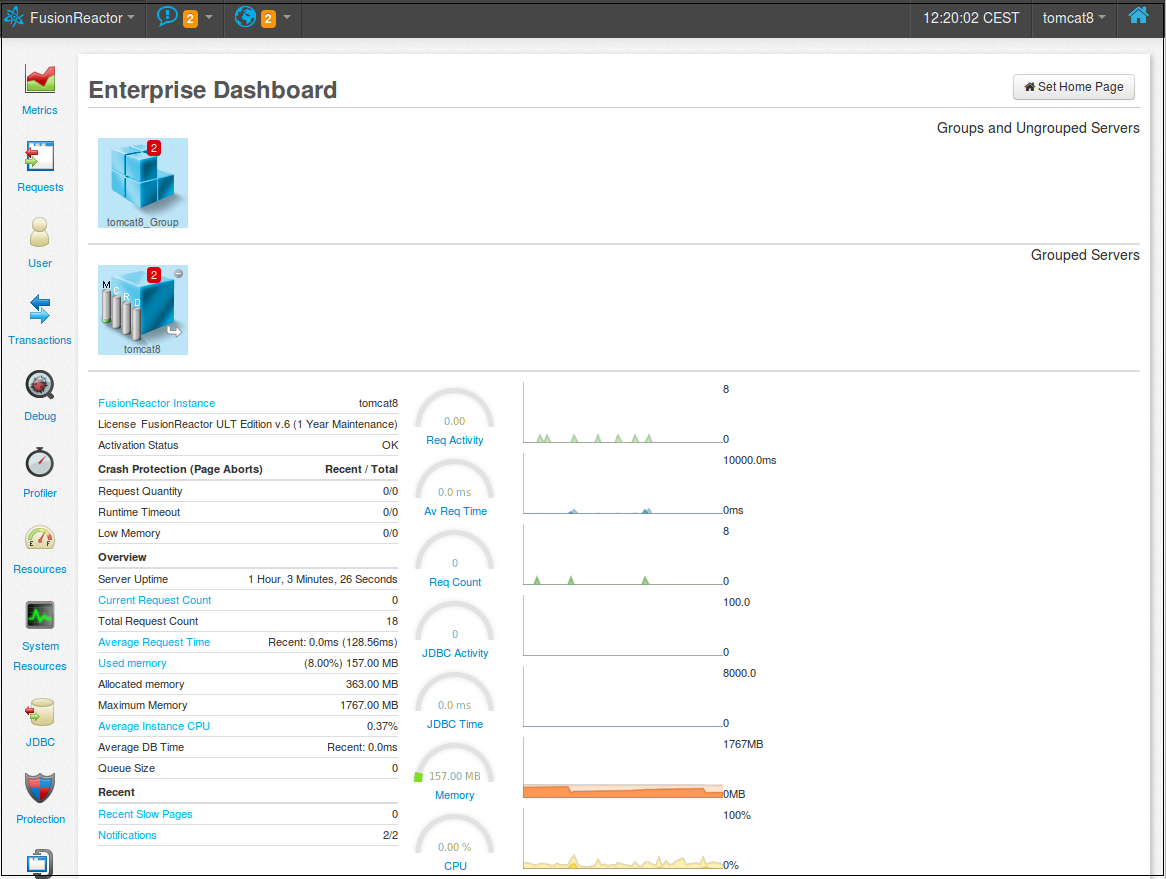
View new group in the Enterprise Dashboard
After the creation of the group, you can access the Enterprise Dashboard and see that a new group has been created.
Ephemeral Data Service
The Ephemeral Data Service provides Enterprise Dashboard services to containerized (dockers) or otherwise short-lived FusionReactor instances by allowing them to auto-register with the dashboard, and providing a tunnel to access their user interfaces.
You can use the Ephemeral Data Service to get instant insight into your fleet of containers. It is possible to mix Ephemeral instances and traditionally-configured instances in the same dashboard, and you can group them together or separately.
When an instance registers to the Enterprise Dashboard, it establishes an SSL secure channel to FRAM. This tunnel is used to get metric data and as a proxy for web requests. This means that FusionReactor instances within your containerized overlay network – which were previously opaque and unavailable to you – can now be accessed directly from the Enterprise Dashboard. All the functionality of FusionReactor's user interface is available.
Note
With the Ephemeral Data Service, if an instance becomes unresponsive or goes offline, it is not possible to receive an alert as the instance unregisters from the dashboard automatically.
Adding servers to the Enterprise Dashboard
To add instance of FusionReactor to the Enterprise Dashboard, you can either manually add the servers or use the Ephemeral Data Service to automatically register instances when they start.
Manually adding instances
You can manually add a server in the Manage Servers page of the Enterprise Dashboard. You can also specify to add servers to the FRAM Enterprise Dashboard if you use Instance Manager to install the instance and specify the Add to FRAM Enterprise Dashboard option
Automatically adding instances
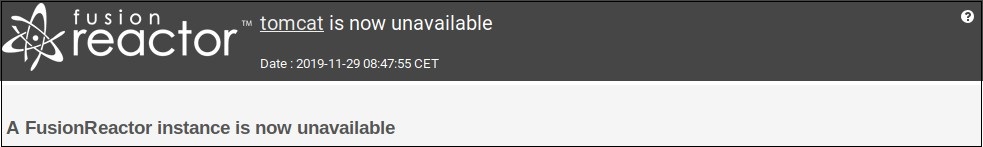
Restart or connection issue alerts
Instances that were manually added to the Enterprise Dashboard will be actively monitored and generate alerts if an instance restarts or becomes unresponsive.
These alerts come in the form of notifications in FusionReactor or through an email alert.
Note
In order to receive email notification you will need to configure the email settings in FusionReactor.
Enterprise scripting
FusionReactor (Enterprise / Ultimate Edition) can trigger a script when a server becomes unresponsive, and when it becomes responsive again. This mechanism might allow you to pro-actively attempt to restart a failed server or instance, integrate FusionReactor into an existing monitoring environment or provide custom logging or reporting. Any program which is runnable on your FusionReactor monitoring system may be used an Enterprise Script target.
On Unix and Unix-based systems, this includes everything you can start from a command line, for instance:
1 2 3 | |
On Windows systems, anything that is runnable as a binary, or can be run from the command prompt, for instance:
1 2 | |
How are the scripts run?
FusionReactor runs these scripts by spawning them using Java system commands. The scripts will be run in the context of the user under commands. The scripts will be run in the context of the user under which your application server runs. This user must have at least read + execute access to these scripts. Any files or other executables called by the script must also be accessible by this user.
The script will be run with the current working directory (CWD) of the application server. Because of the variety of platforms available, this may be unpredictable. Any scripts you write should therefore not use the current directory notation (usually a single dot) to address files. If you plan to access files within the script, their paths should be specified completely.
Learn more
Need more help?
Contact support in the chat bubble and let us know how we can assist.