Time Graph
Transactions > Time Graph displays all transaction performance data currently stored by FusionReactor. In the top right of the page next to the Set Home Page you can switch graphs quickly by clicking the JDBCRequest button to be switched to the WebRequest graph - this works both ways. In addition you are able to switch to the Transactions Activity graph by clicking Activity.
Below is a sample image of the JDBCRequest (Time) graph with the tool-tip showing.
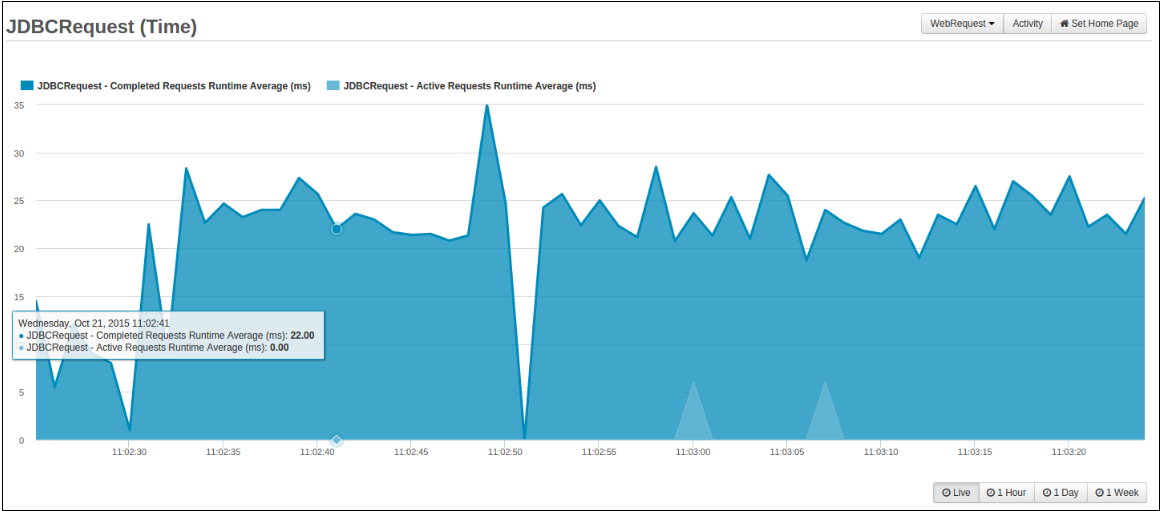
JDBCRequest (Time) Graph
Several time spans are available, with differing resolutions. These are filled as data points are collected by FusionReactor.
Each time varying graphs shows two independent values overlaid:
JDBCRequest - Completed Requests Runtime Average (ms) : Blue - The average execution time of the completed JDBC transactions since the previous sample on the graph, and the average execution time of active JDBC transactions at the point that the sample is taken.
JDBCRequest - Active Requests Runtime Average (ms) : Light Blue - This graph gives insight into the JDBC Transaction performance; if the average execution time of the active JDBC transactions is continuing to increase it could be that some database transactions are hanging.
Deselect and reselect each independent values by simply clicking on their respective names, when a value is deselected (Greyed out) then that value will no longer be displayed on the activity graph.
Placing your mouse pointer on a data point within the graph shows a tool-tip with details about that sample, including :
- Date and time of the request
- Completed Request Runtime Average (ms)
- Active Request Runtime Average (ms)
When browsing the 1 Hour, 1 Day, and 1 Week activity graphs you are able to select time frames by using the slider under the graph to pinpoint specific days, times and spikes in your JDBC Requests.
WebRequest (Time) graph
Several time spans are available, with differing resolutions. These are filled as data points are collected by FusionReactor.
Each time varying graphs shows two independent values overlaid:
WebRequest - Completed Requests Runtime Average (ms) : Blue - The average execution time of completed web requests since the previous sample on the graph.
WebRequest - Active Requests Runtime Average (ms) : Light Blue - The average execution time of active execution of all active requests at the point that the sample is taken.
Deselect and reselect each independent values by simply clicking on their respective names. When a value is deselected (greyed out) then that value will no longer be displayed on the activity graph.
Placing your mouse pointer on a data point within the graph shows a tool-tip with details about that sample, including :
- Date and time of the request
- Completed Request Runtime Average (ms)
- Active Request Runtime Average (ms)
When browsing the 1 Hour, 1 Day, and 1 Week activity graphs you are able to select time frames by using the slider under the graph to pinpoint specific days, times and spikes in your Web Requests.
Need more help?
Contact support in the chat bubble and let us know how we can assist.