Web Metrics
The Web Metrics page presents the data recorded by FusionReactor related to your application server and its request load in an organized and easy-to-analyze structure.
This page contains several graphs and tables categorizing the data.
Graphs
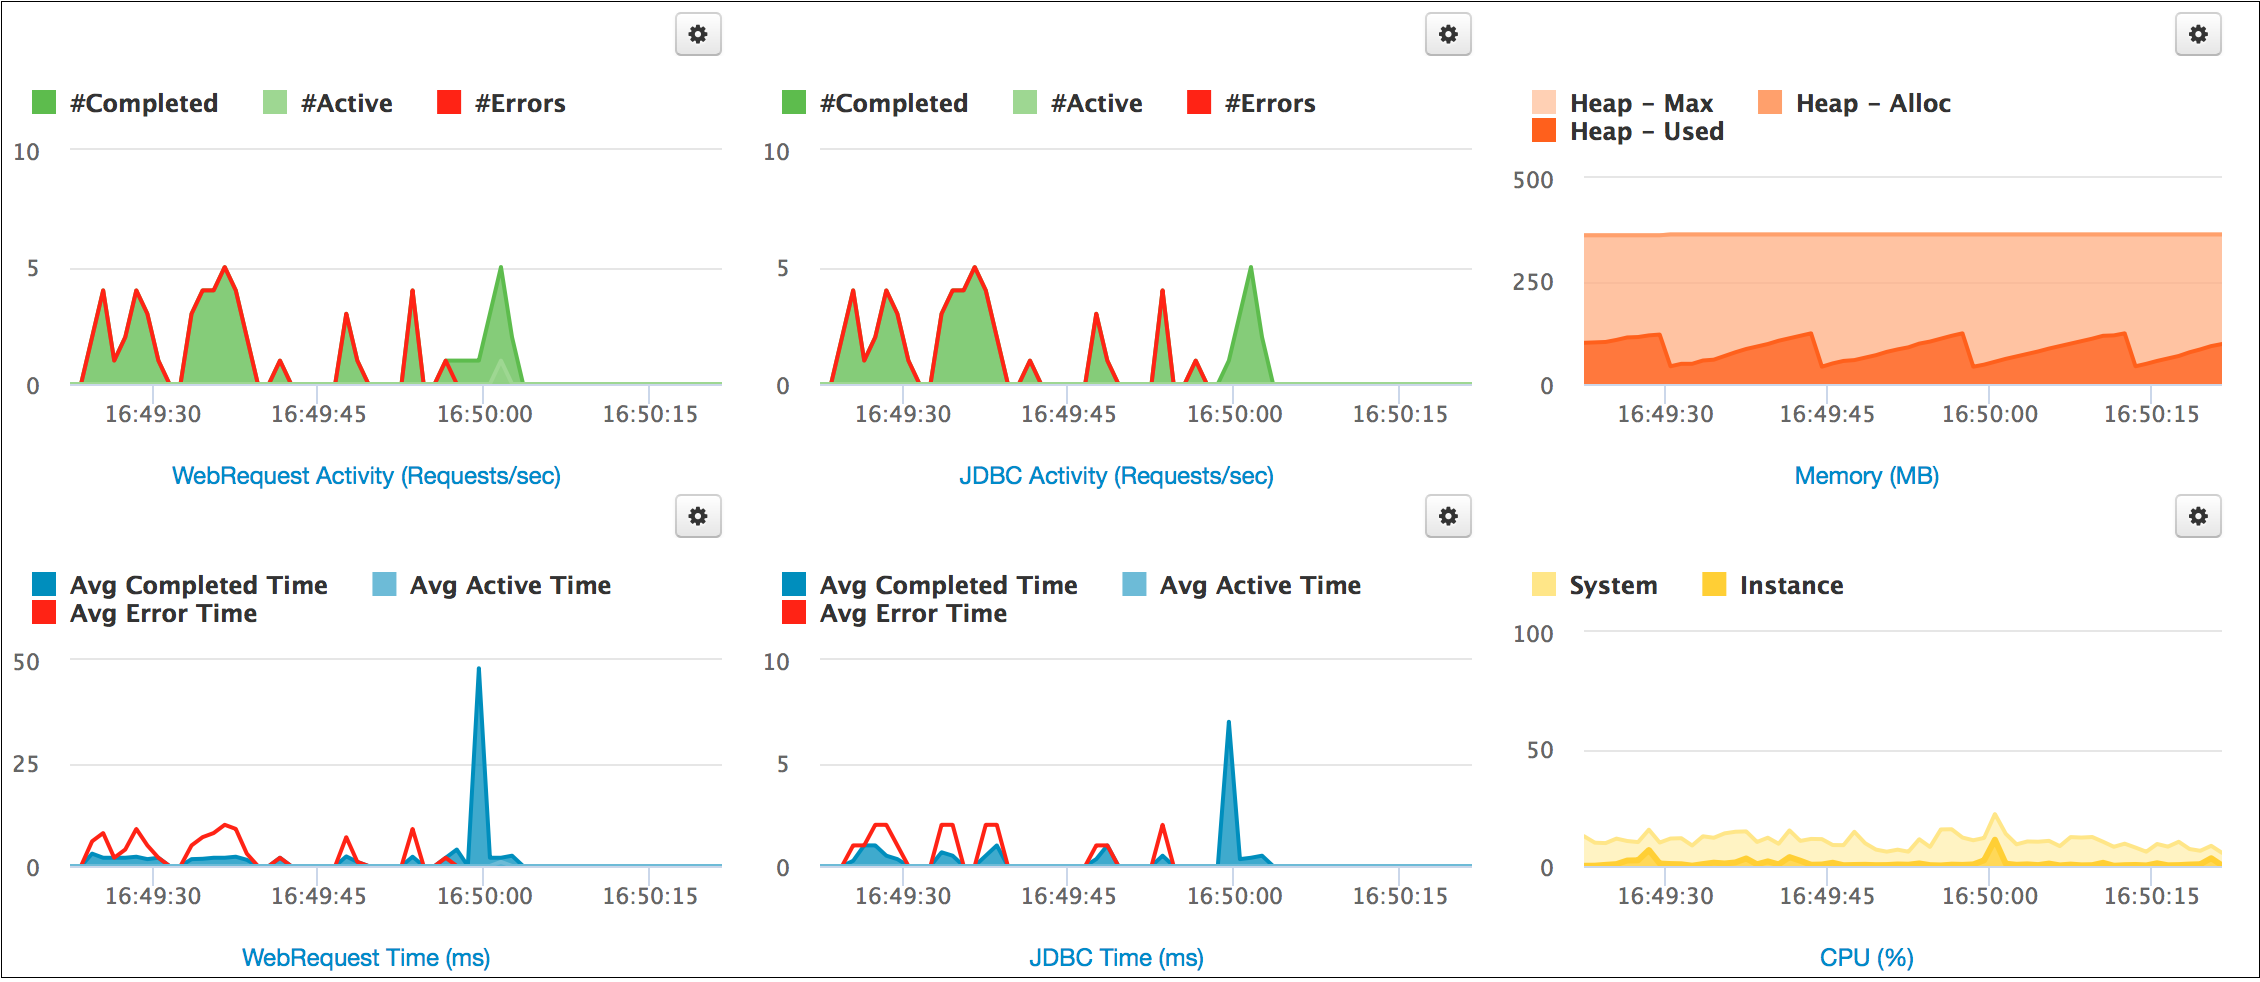
By default, there are six graphs labelled as follows:
- WebRequest activity: The number of requests completed and active at a given time. The number of errors is also tracked.
- WebRequest time: The average time of all completed and active requests at a given time. The runtime of requests which ended in error is also tracked.
- JDBC activity: The number of JDBC requests complete and active at a given time. The number of errors is also tracked.
- JDBC time: The average time of all completed and active JDBC requests at a given time. The runtime of JDBC statements which ended in error is also tracked.
- Memory (MB): The memory usage of your server, showing three types : Max memory, Allocated memory, and Used memory.
- CPU(%): The CPU load of two types - your server, and your application server instance.
Customizing graphs
The graphs available allow a variety of customization.
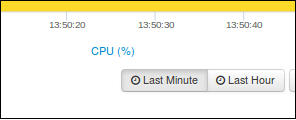
You are able to change the time range shown on the graph by selecting one of the time choices at the bottom-right of the graphs.
Clicking on the  icon next to a graph, a pop-up form will appear allowing you to be able to change various features of that graph.
This modal, or pop-up, can be used to customize the graphs that are displayed on the Web Metrics page.
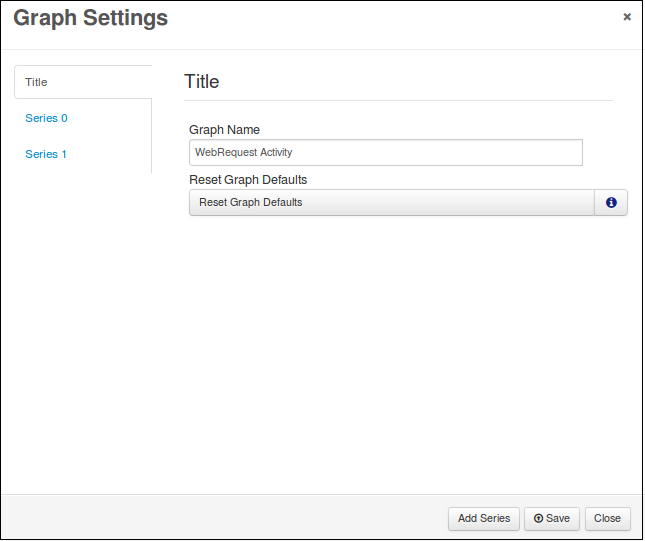
Title
| Field name | |
|---|---|
| Graph name | This is the title of the graph and is used as the label displayed under the graph on the Web Metrics page. |
| Reset graph defaults | This button will reset the selected graph to its default configuration. |
Series X
| Field name | |
|---|---|
| Select series | This should be the series that you want to be displayed. Note: If the series has not been detected on the system yet you will see a series ID in place of the series title. E.g. /transit/txntracker/JDBCRequest/history/activity in place of JDBCRequest - Activity (Requests/sec) |
| Fill color | Used to set the fill color for this series, on the graph. |
| Line color | Used to set the line color for this series, on the graph. |
Add series
In order to add a series to the graph, click the Add Series button on the bottom of the model. This will replicate the last series in the list, you will then have to change the settings for the new series.
Tip
There is no limit on the number of series per graph.
Info
There is no limit on the number of series that can be added to each graph. However, adding many series to the graphs will impact page performance.
Remove series
To remove a series from the graph, click the Remove Series button on the series you want to remove.
Note
You cannot remove the first series.
Enlarging graphs
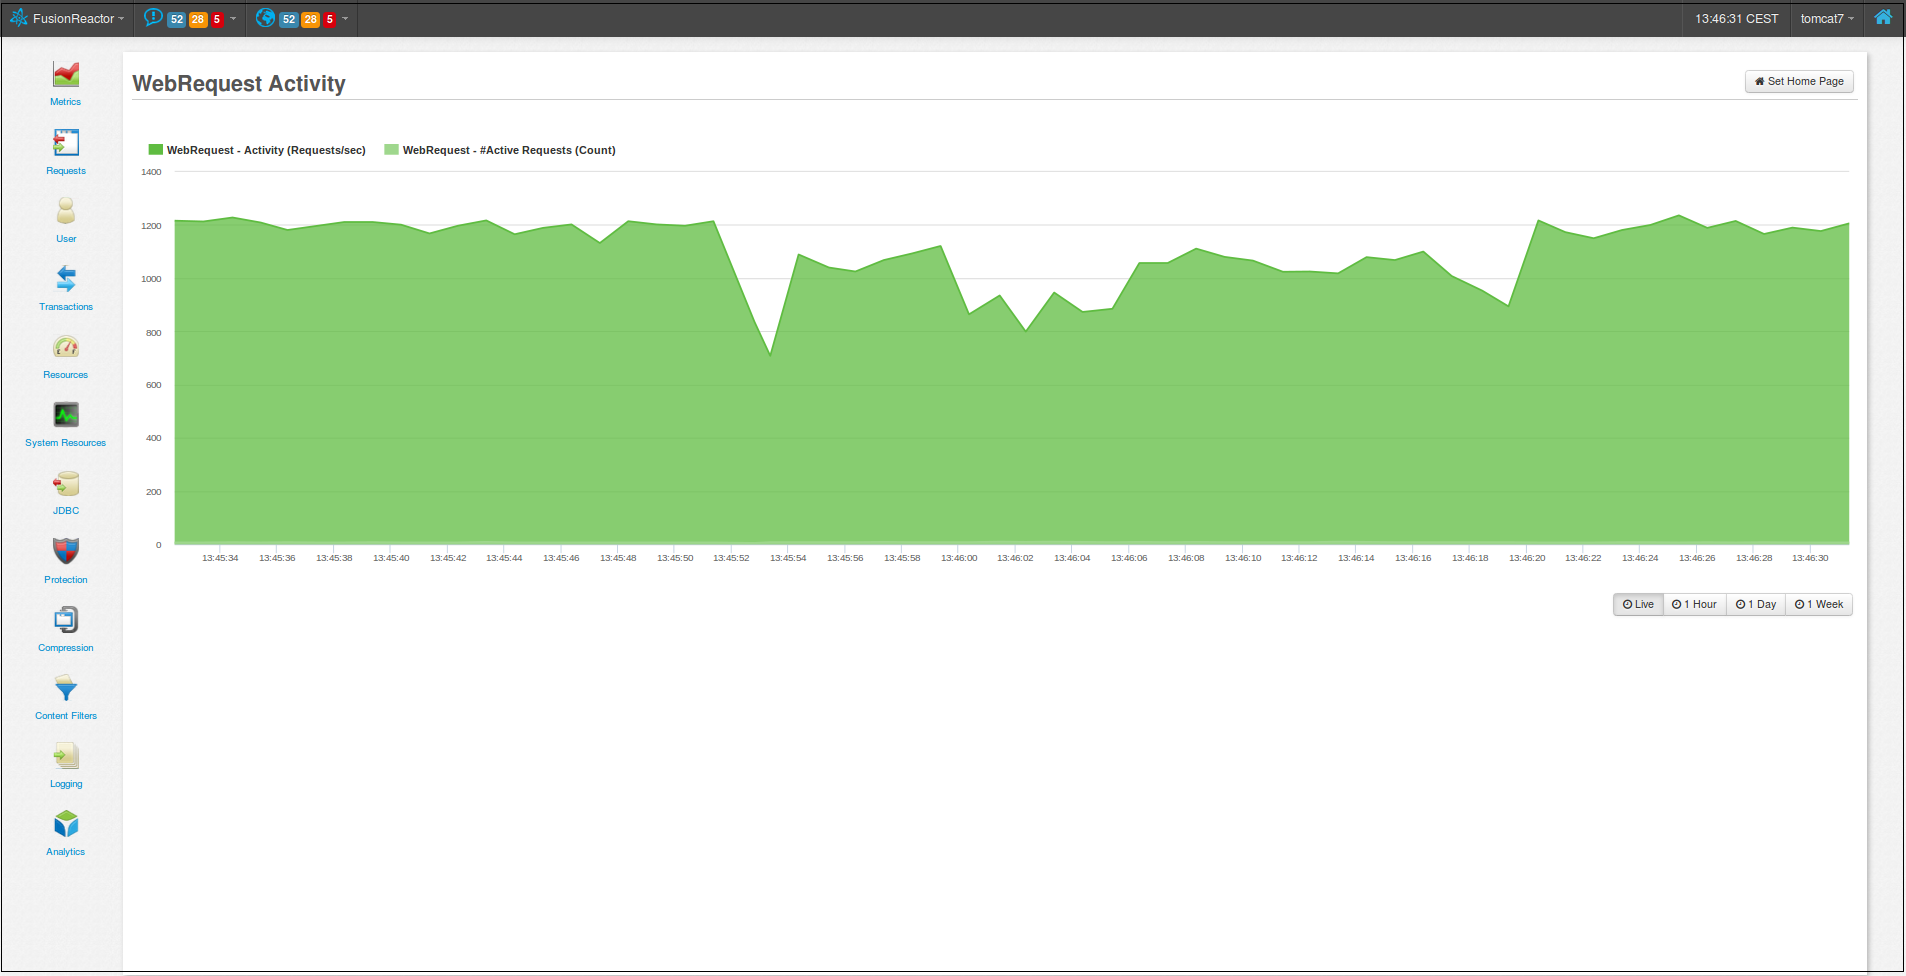
You are able to enlarge a graph by clicking on its name below the graph. This will take you to a page showing just this graph only.
Tables
Overview table
The Overview table displays general statistics about the application server.
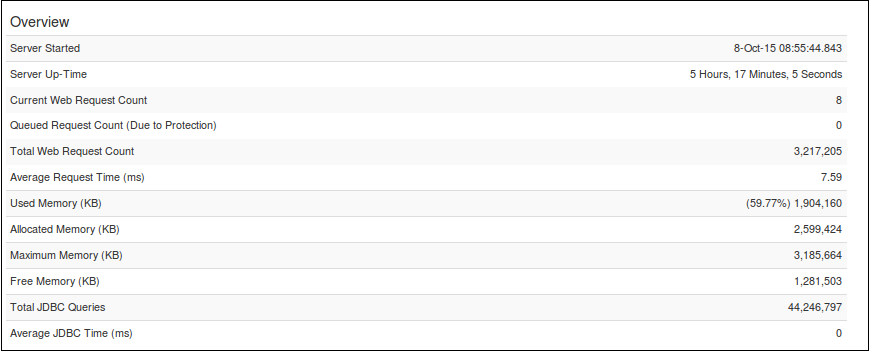
The following is displayed in the table above:
| Field name | Description |
|---|---|
| Server Started | The time the application server started. |
| Server Up-Time | How long the application server has been active for. |
| Current Web-Request Count | The number of requests currently active. |
| Queued Request Count (Due to Protection) | The number of requests currently in the queue to be processed. See Protection. |
| Total Web Request Count | The total amount of web requests that the application server has handled. |
| Average Request Time (ms) | The average time a request is taking to be processed. |
| Used Memory (KB) | The amount of used memory at the given time. |
| Allocated Memory (KB) | The current amount of memory allocated to the application server. |
| Maximum Memory (KB) | The maximum memory limit of the application server. |
| Free Memory (KB) | The current amount of memory not being used and available. |
| Total JDBC Queries | The total amount of JDBC queries that have run. |
| Average JDBC Time (ms) | The average time a JDBC query is taking to process |
Counts table
The Counts table provides numbers on the state of Web Requests and JDBC Requests by your Application Server within the last 60 seconds.
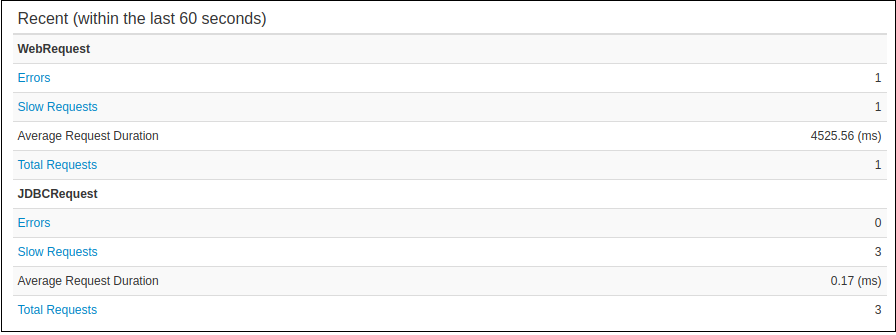
The following is displayed in the table above:
| Field name | Description |
|---|---|
| WebRequest - Errors | The number of Web Requests with errors in the last 60 seconds. |
| WebRequest - Slow Requests | The number of slow Web Requests in the last 60 seconds. |
| WebRequest - Average Request Duration | The average request duration of Web Requests in the last 60 seconds. |
| WebRequest - Total Requests | The total amount of Web Requests that have processed on your application server. |
| JDBCRequest - Errors | The number of JDBC Requests with errors in the last 60 seconds. |
| JDBCRequest - Slow Requests | The number of slow JDBC Requests in the last 60 seconds. |
| JDBCRequest - Average Request Duration | The average request duration of JDBC Requests in the last 60 seconds. |
| JDBCRequest - Total Requests | The total amount of JDBC Requests that have processed on your application server. |
Recent table
The Recent table shows information about recent Web Requests and JDBC Requests (recent meaning any requests within the last minute).
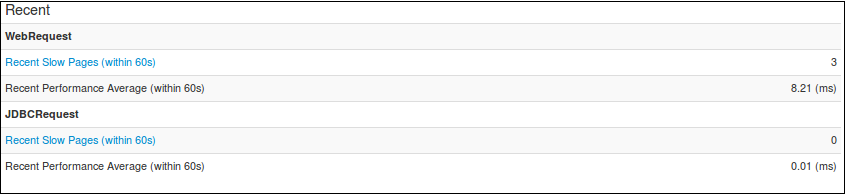
The following is displayed in this table:
| Field name | Description |
|---|---|
| WebRequest - Recent Slow Pages (within 60s) | Shows any Web Requests that have taken longer than the set speed at Transactions->Settings, and are therefore classed as slow, in the last 60 seconds. |
| WebRequest - Recent Performance Average (within 60s) | The average speed of all slow Web Requests in the last 60 seconds. |
| JDBCRequest - Recent Slow Pages (within 60s) | Shows any JDBC Requests that have taken longer than the set speed at Transactions->Settings, and are therefore classed as slow, in the last 60 seconds. |
| JDBCRequest - Recent Performance Average (within 60s) | The average speed of all slow JDBC Requests in the last 60 seconds. |
Protection table
This table displays the statistics of the Crash Protection triggers, displaying the type of protection that caused the trigger.
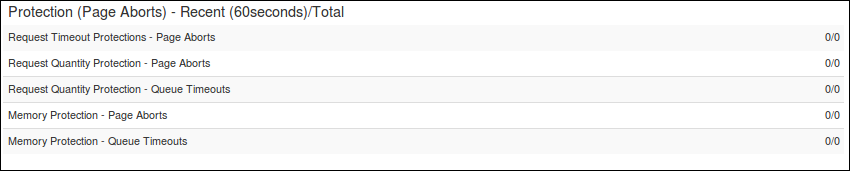 The following is displayed in this table, all giving the amount to
trigger in the last 60 seconds, and the amount since application server
start:
The following is displayed in this table, all giving the amount to
trigger in the last 60 seconds, and the amount since application server
start:
| Field name | Description |
|---|---|
| Memory protection - Page aborts | The number of requests that were aborted because they ran whilst the heap has surpassed the configured percentage threshold for the configured time limit in Protection. |
| Memory protection - Queue timeouts | The number of requests that were queued because they ran whilst the heap has surpassed the configured percentage threshold for the configured time limit in Protection. |
| Request quantity protections - Page aborts | The number of requests that were aborted because they ran whilst the number of running requests is above the configured amount in Protection. |
| Request quantity protections - Queue timeouts | The number of requests that were queued because they ran whilst the number of running requests is above the configured amount in Protection. |
| Request timeout protections - Page aborts | If a request takes longer than the specified time limit, it is aborted. This is the value of aborted requests in the form (last 60 secs)/(Total) |
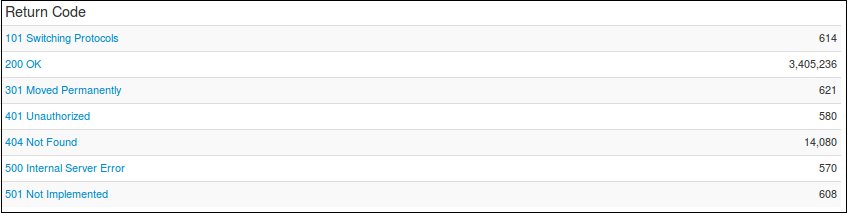
Return code table
This table lists all HTTP return codes which have been returned by this application server. Each return code is also a link showing all requests from the current request history which have that return code.
Garbage collection
Due to the nature of the Java Garbage Collector, this may not be instantaneous.
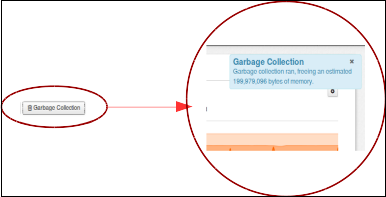
A button has been included on this page to allow for manual garbage collection, at the bottom-right of the graphs. After clicking this button, you will receive a toast notification indicating how much memory was freed.
Garbage Collection will attempt to reclaim memory being taken up by objects that are no longer in use by the program, thereby increasing the amount of free memory.
Need more help?
Contact support in the chat bubble and let us know how we can assist.