FusionReactor Reports Plugin
The report plugin polls the metrics every minute and gathers data throughout the day. This data is then used to create a several reports for your server including daily, weekly and monthly reports.
With the data being collected every minute, when the server goes down all data after the latest gather will be lost, although all other data for the day will remain persistent.
Initial Setup
This plugin is enabled by default, but will not send an email until the email settings are set in FusionReactor->Settings. For more information on setting these see Email Settings. Once these are set there is nothing else you need to do to start receiving reports.
Standard Daily Report
When using the standard version of FusionReactor you will receive the daily report that is very similar to the older versions of FusionReactor.
There have been some changes to the report to improve the layout, and a few more values have been added.
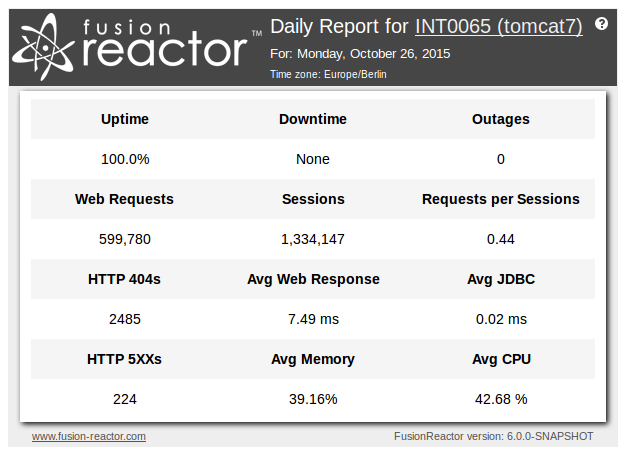
Figure 1: An example standard daily report.
Warning
The reports will also contain warning about some possible problems that are detected on your server.
If you see the warning banner about clock drift, this means that FusionReactor believes that the clock on your server is not keeping correct time.

This is calculated by the data gathering thread. This thread collects the data from the system every 60 seconds, and determines clock drift by detecting if the time between the collections is different than the expected time (within a acceptable margin of error).
If you are consistently seeing this warning on the reports, you should consider checking the clock settings for you system.
See these links for setting up NTP (Network Time Protocol) on your server.
Table Values
The Daily Report plugin sends an email daily with a number of values, in the header is instance name along with the date the data is for, below is a table explaining what each of the values in the table of the email mean.
| Field Header | Number | Format | Description |
|---|---|---|---|
| Uptime | 1 | % | This shows the percentage of 24 hours that instance has been classed as 'up' based on the downtime value. |
| Downtime | 2 | HH:MM:SS | This shows the amount of time that the server has been down. |
| Outages | 3 | Integer | This shows the number of times the plugin has registered that the server has gone down. |
| Web Requests | 4 | Pages | This shows the number of web requests the instance has handled. |
| Sessions | 5 | Sessions | This shows the number of sessions the instance has seen. |
| Req per Session | 6 | Pages/Sessions | This shows the number of pages divided by the number of sessions (average requests per session). |
| HTTP 404s | 7 | Integer | This shows the count of the number of pages that returned a 404 error code. |
| Avg Web Response | 8 | Ms | This shows the average time it takes for the instance to handle web requests. |
| Avg JDBC | 9 | Ms | This shows the average time it takes for the instance to handle database requests. |
| HTTP 500s | 10 | Integer | This shows the count of the number of pages that returned a 5xx error code. |
| Avg Memory | 11 | % | This shows the average heap memory used by the instance. |
| Avg CPU | 12 | % | This shows the average CPU resources used by the instance. |
Enterprise Daily Report
When using the enterprise edition of FusionReactor the Standard Daily Report is replaced with the Enterprise Daily Report.
This report is more comprehensive and includes a breakdown of the outages and error codes, metric targets and the previous values for each metric.
Header
The header for the Enterprise Daily Report contains some information that can be important when identifying the instance.
The first line identifies the type of report (daily/weekly/monthly) and the instance it was sent from.
The FusionReactor instance is identified by link, in this example "6e9b20a222d4(tc-Docker-fr)". This is the host name of the server and the instance name of the FusionReactor. In this example the host name is "6e9b20a222d4" and the instance name is "tc-Docker-fr". This is also a link to the instance using the displayed host name (6e9b20a222d4). This can be changed using the "Host Name" setting on the FusionReactor -> Settings page.
The second line shows the date for which the report is for. In this example the date is "Monday, September 7, 2015". This means that the data displayed is (when using the default settings) from between 07-Sep-2015 00:00 and 07-Sep-2015 23:59, and was sent 08-Sep-2015 00:05.
The third line shows the time zone for the server, in this case 'Etc/UTC'.
Warning
The reports will also contain warning about some possible problems that are detected on your server.
If you see the warning banner about clock drift, this means that FusionReactor believes that the clock on your server is not keeping correct time.
This is calculated by the data gathering thread. This thread collects the data from the system every 60 seconds, and determines clock drift by detecting if the time between the collections is different than the expected time (within a acceptable margin of error).
If you are consistently seeing this warning on the reports, you should consider checking the clock settings for you system.
See these links for setting up NTP (Network Time Protocol) on your server.
https://help.ubuntu.com/lts/serverguide/NTP.html
https://technet.microsoft.com/en-us/library/cc773263%28v=ws.10%29.aspx
Main Body
Each tracked metric in this section is split into 3 numbers.
- The main central number is the current value for this report.
- The smaller number in brackets (bottom right) is the value from the previous report.
- Finally the number in the bottom left is the current target value for this metric.
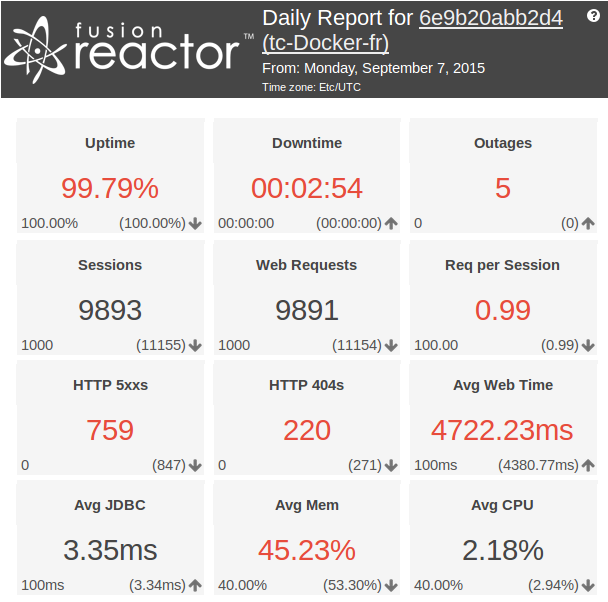
Figure 1: Main body of report
Outage Details
The outage details table lists all the outages for time tracked by this report.
This table contains the following information:
- Start - The time the outage started at. This is calculated as the last heartbeat time in the stored values. (Therefore can be up to 1 minute out).
- End - The time the outage ended. This is calculated as the start time of the server, after the outage.
- Duration - The duration of the outage.
- Reason - The detected reason for the outage (Restart/Crash).
The reason for the crash is based on the FusionReactor lock files. These files are created by FusionReactor on start to prevent the same instance starting twice. If the server is rebooted cleanly then these files are deleted by the system, however if the system does not shut down clean, the lock files will remain. If the lock files are present on start-up FusionReactor will see this as a crash.
To prevent the email from getting too large, the outage section is limited to the 10 longest outages for the weekly and monthly reports.
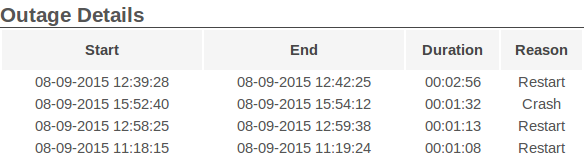
Figure 2: Outage details for the day
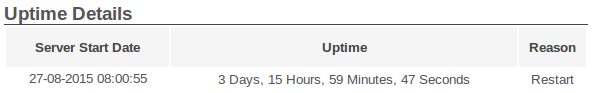
If you have not experienced any outages for the whole day, then this table is replaced with an "Uptime Details" table.
Uptime Details
The uptime details table is a short table that shows the details of the server uptime.
This table is only displayed if you have no outages for the day.
This table contains the following details:
- Server Start Date - The date and time the application server started.
- Uptime - The duration that the server has been up.
- Reason - The reason the server was last restarted (restart/crash)
Status Codes
This table is only displayed if you have web requests.
The last section of the Enterprise Daily Report is the status code table. This table contains a break down of the different HTTP status codes seen by FusionReactor within the tracked period for the report.
This table contains the following details:
- Status Code - The HTTP status code and description.
- Count - The number of this code seen during the report period.
- Average Runtime - The average runtime for these codes during the report period.
- % of Requests - The percentage of all web requests that this code makes up.
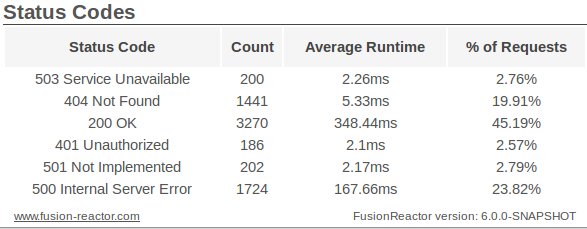
Figure 2: HTTP status codes for the day
Weekly Report
This report is effectively the same as the Enterprise Daily Report, with the exception to the 'Overview Graph' and that this report is sent once a week and summarizes the past 7 days.
By default this report will send on Monday morning, this can be changed via the report configuration page.
To prevent the email from getting too large, the outage section is limited to the 10 longest outages for the weekly and monthly reports.
This graph shows the web request throughput and average runtime for each day that has been tracked by FusionReactor.
This graph has two axis and two series, Runtime and Throughput.
- Runtime - This series uses the left axis, and shows the average runtime for web requests for that day (in milliseconds).
- Throughput - This series uses the right axis, and shows the total number of web requests for that day.
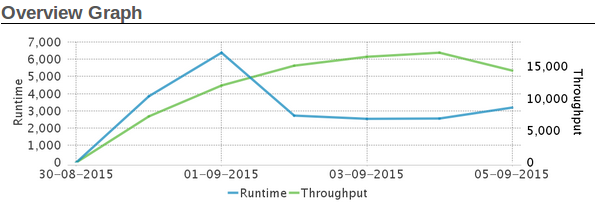
Figure 1: Overview graph from a weekly FusionReactor report.
Monthly Report
This report is similar to the Enterprise Daily Report and Weekly Report, except that this report is sent on a monthly basis (the first day of each calender month, for the previous calender month).
This report includes everything that the Enterprise Daily Report and Weekly Report include plus the following sections:
- Day Break Down
- Response Codes
- Day of Week Break Down
The 'Overview Graph' section in the monthly report is the same style as the weekly report graph, however it is for the whole month rather than for the 7 day week.
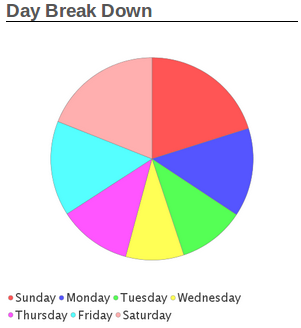
Day Break Down
The Day Break Down graph is intended to give a quick overview of what the busiest days of the week have been in the last month.
This graph is graphing the number of requests for the month grouped by the day of week.
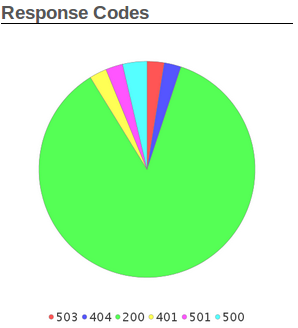
Status Codes
The status codes graph is intended to give a quick overview of the break down of HTTP status codes tracked by FusionReactor for the calender month.
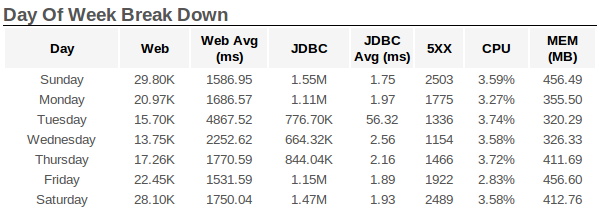
Day of Week Break Down
This table shows the break down of the month by day of week. Each row of this table shows the sum value for each day of the week.
- Day - The day of the week.
- Web - The total number of web requests.
- Web Avg (ms) - The total average (mean) runtime for web requests.
- JDBC - The total number of JDBC requests.
- JDBC Avg (ms) - The total average (mean) runtime for JDBC requests.
- 5XX - The total number of 5XX status codes seen.
- CPU - The average (mean) CPU usage.
- MEM (MB) - The average (mean) heap memory usage.
Configuration
The FusionReactor Report Plugin Configuration (accessible from the Active Plugins page) allows you to alter the following:
Time Settings
| Configuration | Description |
|---|---|
| Active | The state of the pluign, set to 'Disabled' to disable all the reports. This setting must be set to 'Enabled' to receive any email reports. |
| Send Time | The time of the day to send the emails. Use the format HH:MM. (Use 24 hour clock, 23:00 = 11 PM) If this value is before the 'End of Day' value the report will be sent the following day. e.g. Send time = '00:00', End of Day = '00:05'; The report for Monday, will be sent at midnight between Tuesday and Wednesday. As Monday did not end until 5 mins past the send time. |
| End of Day | The time of the day when the data should reset. Use the format HH:MM. (Use 24 hours clock, 23:00 = 11 PM) |
| End of Week | The day of the week to be used as the end of the week. |
Targets
When using the enterprise or ultimate version of FusionReactor you can set the target values for the tracked values in the reports. These values are displayed on the report, and used to determine the colour of the value (see the docs on the individual reports for more details).
| Configuration | Default | Unit | Description |
|---|---|---|---|
| Uptime | 100 | % for the Day | This is the target for the uptime percentage. |
| Downtime | 00:00:00 | HH:MM:SS | This is the target for the downtime. |
| Outage | 0 | Number of outages per day | This is the target value for number of outages. |
| Sessions | 1000 | Number of sessions per day | This is the target for the number of sessions. |
| Web Requests | 100 | Number of web request per day | This is the target for the number of web requests. |
| Req per Session | 100 | Average number of requests per session per day | This is the target for the number of requests per session. The value for requests per session is an average of (requests/sessions) not the actual average of requests made by each session. FusionReactor can not currently track requests to an individual session. |
| HTTP 5XX | 0 | Number of 5XX codes per day | This is the target value for the number of HTTP 5XX codes. This includes all 500 codes, e.g. 500, 501, 503, etc. |
| HTTP 404 | 0 | Number of 400 codes per day | This is the target value for the number of HTTP 404 codes. |
| Avg Web Time | 100 | Average web request runtime in milliseconds | This is the target for the average time each web request takes. |
| Avg JDBC Time | 100 | Average JDBC runtime in milliseconds | This is the target for the average time each JDBC request takes. |
| Avg Mem | 40 | % memory usage for the day | This is the target for the average heap memory usage. |
| Avg CPU | 40 | % CPU usage for the day | This is the target for the average system CPU usage. |
Custom Metrics
With am enterprise or ultimate version of FusionReactor. The reports allow you to add 3 custom values to the reports to track additional metrics that you might find important over the standard values.
| Configuration | Description |
|---|---|
| Custom Metric | This is the name of the series to track. This list includes all the tracked series in FusionReactor. Including those that are already tracked by the report. Set to 'NONE' to not use this metric. |
| Target Metric | The target of the metric, if the value should be above or below the target value. |
| Target Value Metric | This is the value for the target of this metric. |
Daily Report
| Configuration | Description |
|---|---|
| Enabled | Enables/Disables the Daily Report feature. If disabled, the report will not send. Default is Enabled. |
| Recipients | A mailing list of addresses to send the report. If this is configured, emails will not be sent to those specified in the general FusionReactor Settings. |
| This should be a comma (,) or semicolon(;) separated list of email address. |
Weekly Report
| Configuration | Description |
|---|---|
| Enabled | Enables/Disables the Weekly Report feature. If disabled, the report will not send. Default is Enabled. |
| Recipients | A mailing list of addresses to send the report. If this is configured, emails will not be sent to those specified in the general FusionReactor Settings. |
| This should be a comma (,) or semicolon(;) separated list of email address. |
Monthly Report
| Configuration | Description |
|---|---|
| Enabled | Enables/Disables the Monthly Report feature. If disabled, the report will not send. Default is Enabled. |
| Recipients | A mailing list of addresses to send the report. If this is configured, emails will not be sent to those specified in the general FusionReactor Settings. |
| This should be a comma (,) or semicolon(;) separated list of email address. | |
Status Log - plugin-fr-reports-plugin.log
This plugin creates a log file called plugin-fr-reports-plugin.log which contains information on the status of the plugin, when it started, stopped, if there were any problems. Below is a table explaining what all the attributes in the log file mean.
| Field Name | Number | Description |
|---|---|---|
| Date (Formatted) | 1 | The date on which this log entry was written. |
| Time (Formatted) | 2 | The time on which this log entry was written. |
| Level | 3 | Log Level basically means the nature of the log, for example INFO means general information, where as ERROR means an error is being logged. SEVERE means something really bad has happened, this will be typically followed by the a generated exception. |
| Source System | 4 | The reports system subsection that is logging the message. |
| Log message | 5 | Contains a message of an event that occurred such as logging that has started. |
Troubleshooting Clock drift warnings
It is possible when you receive the Standard Daily or the Enterprise Daily report, and you encounter the warning message "This server is suffering from clock drift!".
The check for clock drift is done every one minute, and if the FusionReactor clock differs from the clock on the server then this is tracked as a clock drift. It is possible that the clocks on the server or FusionReactor have become unsynchronized and therefore, you will see the warning of clock drift in the Standard Daily and Enterprise Daily reports.
Unfortunately, there is no straight forward fix to ensuring the clocks are synchronized. However, If you are consistently seeing this warning on the reports, you should consider checking the clock settings for you system. You could check the clock settings by the use of a network time protocol such as NTP.
More information about the NTP protocol can be found in the links below.
1 2 3 | |
Alternatively, if you are setting the clocks manually, you could change the Standard Daily and Enterprise Daily report send time to ensure that the clocks are synchronized correctly before sending the report.