External Sources
The External Sources page shows an overview of the statistics gathered by FusionReactor, related to external connections. Currently tracking CFHTTP, HTTPClient calls.
Page controls
There are a number of controls on the top of the page that allow filtering of the data.
| Control | Description |
|---|---|
| Database Control | Select the external source you want to view. |
| Time Frame | Select different time frames to view. |
| Clear History | Delete all data for the currently selected database. |
| Set Home Page | Set this as the home page for the currently logged in user. |
| Refresh Control | Set the auto refresh interval for this page. |
| Refresh Button | Immediately refresh the page. |
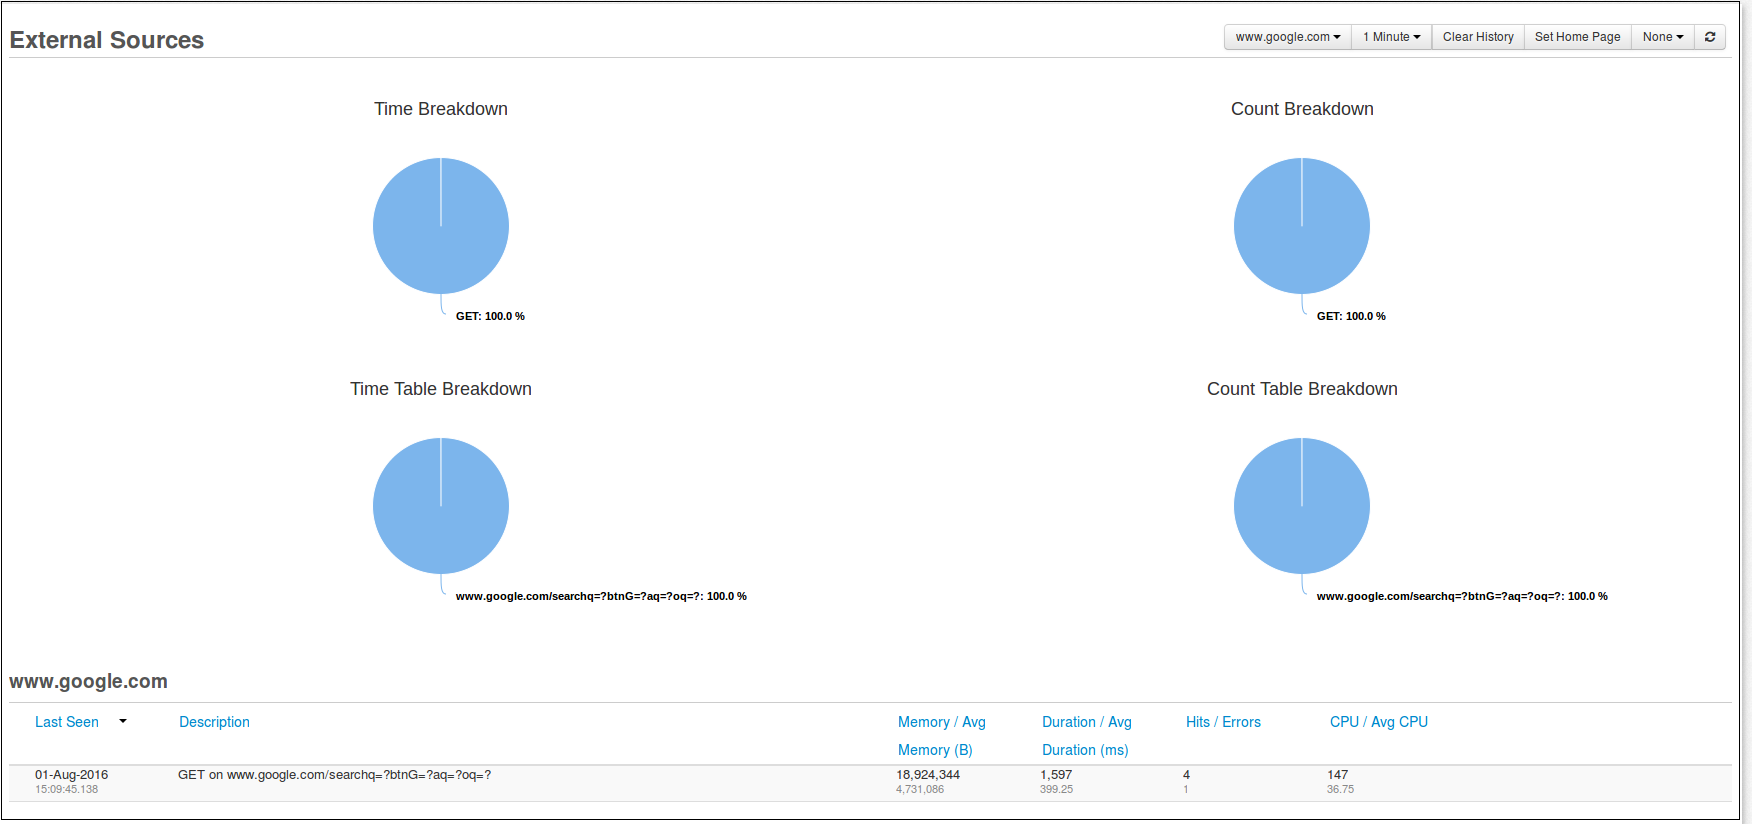
Pie charts
On this page are four pie charts displaying the data for the selected database and time frame. All these charts are limited to displaying nine entries with the 10th becoming an aggregation of the remainder and being called other.
| Name | Description |
|---|---|
| Time breakdown | Shows the time that was spent in each HTTP method (GET, POST, DELETE..). |
| Time table breakdown | Shows the time spent on each transaction type. |
| Count breakdown | Shows the number of requests on each HTTP method (GET, POST, DELETE..). |
| Count table breakdown | Shows the number of requests for each transaction type. |
Table
The table displays the aggregated data in a more detailed view, based on the time frame.
| Column | Description |
|---|---|
| Last Seen | Time at which FusionReactor last saw a request that matched this Hit i.e. The same method to the same transaction type. |
| Description | Description of the 'Hit'. |
| Memory / Avg Memory (B) | Total allocated bytes for this Hit, and the average allocated memory per hit. |
| Duration / Avg Duration (ms) | Total time spent on this Hit, and the average duration per Hit. |
| Hits / Errors | Total number of Hits seen and the number of those hits that reported an error. |
| CPU / Avg CPU | Total time spent on the CPU for this Hit and the average type spent on the CPU for each Hit. |
Need more help?
Contact support in the chat bubble and let us know how we can assist.