Debugger Breakpoints
Introduction
The breakpoint section shows currently-configured breakpoints which have been configured in the FusionReactor Production Debugger, "Debugger". Breakpoints can be created, edited, enabled / disabled and deleted from here, as well as other locations in FusionReactor's user interface.
Breakpoints themselves are split into 2 main sections: the breakpoint configuration which defines when a breakpoint should fire, known as the trigger, and the operation which is then executed when the trigger fires, known as the handler.
Breakpoints also have generic configurations which apply to all breakpoints as they are firing. The two main configurations are the Conditional Configuration and the Rate Limiting configuration. These configurations apply to all breakpoints as they fire and decide if the trigger should really trigger a handler.
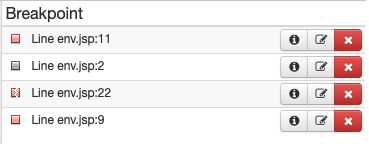
The table shows the configured breakpoints. The first column is the breakpoint icon, which shows the state of the breakpoint. The second column is the trigger which defines when the breakpoint should trigger. The third column contains the breakpoint controls.
The information button opens a popup containing state information about the breakpoint.
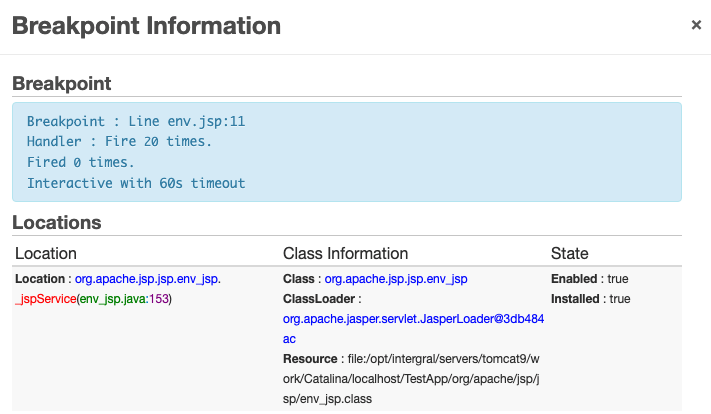
The locations section of this window contains the following fields:
| Location | The full location of the breakpoint. For Example java.lang.Thread.run(Thread.java:745) |
| Enabled | Indicates whether the breakpoint is enabled or disabled. |
| Installed | Indicates whether the breakpoint has been loaded in the JVM for debugging. |
| Class | Points to the loaded class that the breakpoint is within. For Example, java.lang.String |
| Class Loader | The class loader that the targeted class belongs to. For Example, org.apache.jasper.servlet.JasperLoader@44ffb20e |
| Resource | The location of the class file in the file system. For Example, jar:file:/usr/lib/jvm/java-7-oracle/jre/lib/rt.jar!/java/lang/Thread.class |
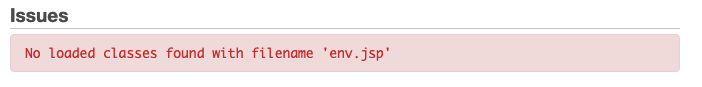
If a breakpoint has been configured, it doesn't necessarily mean that the class has been loaded or if it's enabled.
If there is an issue with the breakpoint, the icon will change to the following:

The information button's locations section will also change to 'Issues', and display information about issues with the breakpoint.
Creating Breakpoints
To create a new breakpoint you can click on the "New Breakpoint" button on the top right of the Debugger page. A modal dialog will open allowing you to specify the configuration for the breakpoint.
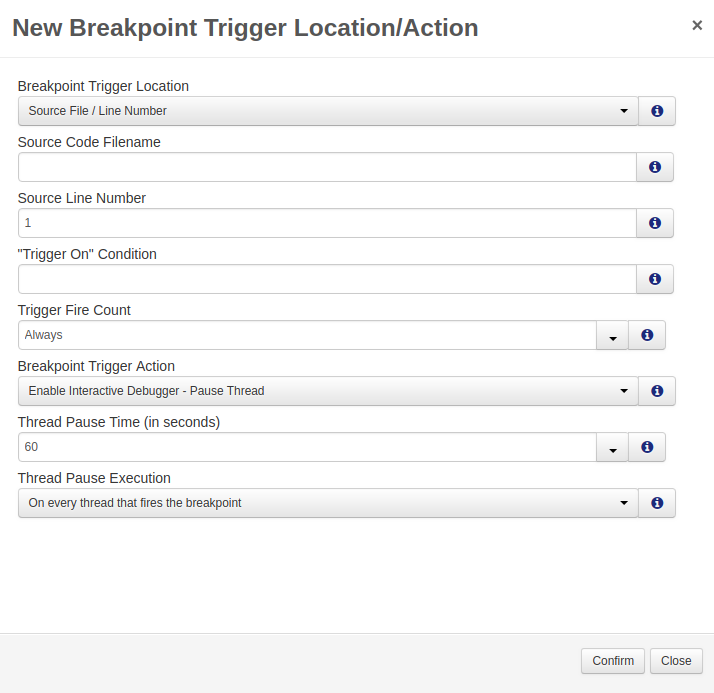
Breakpoint Triggers
The top part of the New Breakpoint dialog allows the user to specify how this breakpoint should be triggered. This can be one of the following:
- Source Code File Name and Line Number
- Exception Thrown / Caught
- Field Access / Modification
- Java Method Entry
- ColdFusion Function Entry
Source Code File Name and Line Number
A breakpoint can be configured to trigger when a specific line number is hit in a source file. For this to work, you need to know the source code file name and the correct line number.
Line numbers with no bytecode (like comments) will not trigger a breakpoint.
For Java classes, the file name is normally the class name + .java.
E.g. for java.lang.String the file name would be String.java
For CFML classes, the file name is normally the absolute path to the
cfm/cfc. E.g.index.cfm would be
/opt/coldfusion10/cfusion/wwwroot/CFIDE/administrator/index.cfm.
Relative file names will work for CFML files.
Exception Thrown and/or Caught
Finally code blocks will appear as a exception caught and re-thrown which means that exception events may fire more than you expect. A breakpoint can be configured to trigger when an exception is thrown or caught. Simply enter the fully qualified exception name and whether it should trigger on exceptions being thrown, and/or caught.
Field Access and/or Modification
A breakpoint can be configured to trigger when fields are
accessed and/or modified. Simply enter the fully qualified class
name with the field name. E.g. java.lang.String.value would monitor
the value field of the String class.
You can configure the trigger to fire on access, modification or both.
Java Method Entry
Java Method Entry Breakpoints can not be configured for Native methods. You will receive a JVMTI error in the FusionReactor Production Debugger Plugin logs if you attempt to.
A breakpoint can be configured to trigger when a specific java method is called. Simply enter the fully qualified class name with the method name. E.g. java.lang.String.toLowerCase would trigger when the toLowerCase method is called.
ColdFusion Function Entry
A breakpoint can be configured to trigger when a specific ColdFusion function is called. Simply enter the absolute path to the cfc/cfm file and the cffunction name.
Conditional Configuration
Conditional breakpoints will only fire if the condition evaluates to either true, none null or number which is not zero.
The conditional breakpoint has access to the variables in the function which is triggering the breakpoint. If a breakpoint is put in CFML code, then the condition will be evaluated through the CF evaluate function. All CF scopes are available as well as any additional Java local variables in the breakpoint.
Example
    for ( int i = 0; i < 10; i++ ) {
      out.println( i );
    }
A condition breakpoint on line 11 with the following condition
i == 5
will only fire when the int variable i is 5.
Specials
There are some special variables which can be used for the specific event types. These variables expose attributes from the trigger for the condition.
Field access + modification variables
__frFieldObject- object whose field is being updated__frFieldValue- current the field value
Field modification variable
__frFieldNewValue- new field value (which will be set)
Exception variables
__frException- the Java exception being thrown__frClassThrowing- Java class throwing the exception__frMethodThrowing- Java reflect method throwing the exception
Rate Limiting
Breakpoints can be configured to disable themselves after being triggered n times. Simply set the "Fire Count" setting to 1 and the breakpoint will only fire once. The Conditional statement is evaluated before the fire count check.
Breakpoint Handlers
The breakpoint handler defines what operation should be performed once the breakpoint has been triggered and all the preconditions (condition and rate limit) have been met.
There are 4 supported handlers :
- Enable Interactive Debugger - Pause Thread
- Generate Email Stack/Variable Event
- Sampler Graph - Capture Event Data
- Set Field Value
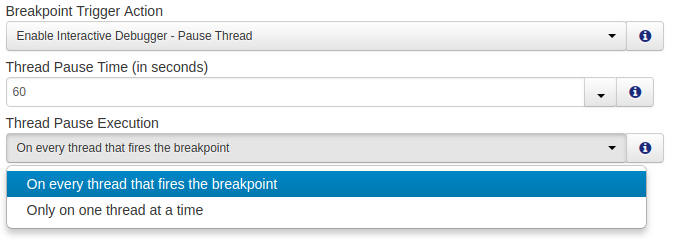
Enable Interactive Debugger - Pause Thread
The interactive debugger allows the thread to be paused and manually stepped. This allows the user to walk through the thread execution and look at the variables as they go. Any paused threads are visible in the paused threads section of the Debugger page.
The interactive debugger supports pausing the thread forever or for a specific amount of time and then resuming. If the user views the paused thread before the timeout occurs, the thread will pause forever regardless of the initial timeout.
The interactive debugger also has an additional thread rate limiter. The user can chose if they want all threads (On every thread that fires the breakpoint) to pause in the debugger or just one at any time (Only on one thread at a time).
The following example will pause the thread for 60 seconds unless the users views the thread in the interactive debugger. It will fire for all threads which the breakpoint fires on.
Generate Email Stack/Variable Event
Email alerts can be sent when a breakpoint is fired. The email include information about the transactions running on the thread, the thread information and stack trace as well as all the variables which are available when the breakpoint was hit. This email is very similar to the crash protection email.
The email alerts from the debugger include specific information about the breakpoint which triggered it. Like the exception being thrown or the field being accessed.
After an email has been sent, it is possible to make the debugger pause the thread in the interactive debugger. If this will happen then the email will contain a link back to the thread view of the request which has paused in the debugger. The email will also say when the thread will resume if it's been configured to timeout.
Please note that the Email Settings need to be configured in order to receive an email alert from the Production Debugger. More information can be found here, Email Settings.
Sampler Graph - Capture Event Data
A breakpoint can be configured to generate a sample. This allows the user to graph how often a specific breakpoint fires and indirectly when some issue / code is being executed. Once a breakpoint has been configured to trigger a sampler, the graph will be available in the Sampler Graphs page. The graph series will exist until the user deletes the breakpoint.
Set Field Value
A breakpoint which has been configured to trigger on field modification can use the "Set Field Value". This allows the user to override the value which is being set. I.e. If the field is set to null, then the Set Field Value handler can be used to set a new non-null value.
Breakpoints
Editing Breakpoints

You can edit the breakpoint by clicking on the edit button (middle button). Editing shows the same dialog as the new breakpoint dialog.
Breakpoint States - Enabling/Disabling and Invalid
Breakpoints can be enabled and disabled by clicking the breakpoint icon, to the left of the breakpoint name.
An enabled breakpoint can have one of the following icons:

A solid red square indicates the breakpoint is enabled and installed.
A broken red square indicates a problem with the breakpoint. The state of the breakpoint, including any issues, can be viewed by clicking that breakpoint information button to the right of the breakpoint name.
A disabled breakpoint will always have this icon

When disabled, the breakpoint will appear as shown below:

Deleting Breakpoints
Breakpoints can be deleted by clicking on the red cross.
Warning
This cannot be undone.