CPU Sampler
The CPU Sampler. This tool can be used to track down the CPU usage of every instantiated thread on the server. Additionally, there are tools provided to use this information in a comprehensive way, thereby detecting any inefficient processes on your server. Note: this feature, just like every Profiler feature, requires a FusionReactor Ultimate or FusionReactor Developer license.
CPU Usage Monitoring
The CPU Sampler is a new feature in FusionReactor 7.1. This feature retrieves and collects all live system thread data and their respective metadata. This includes: thread IDs, thread names, thread groups, thread states and critical CPU timing.
Overview
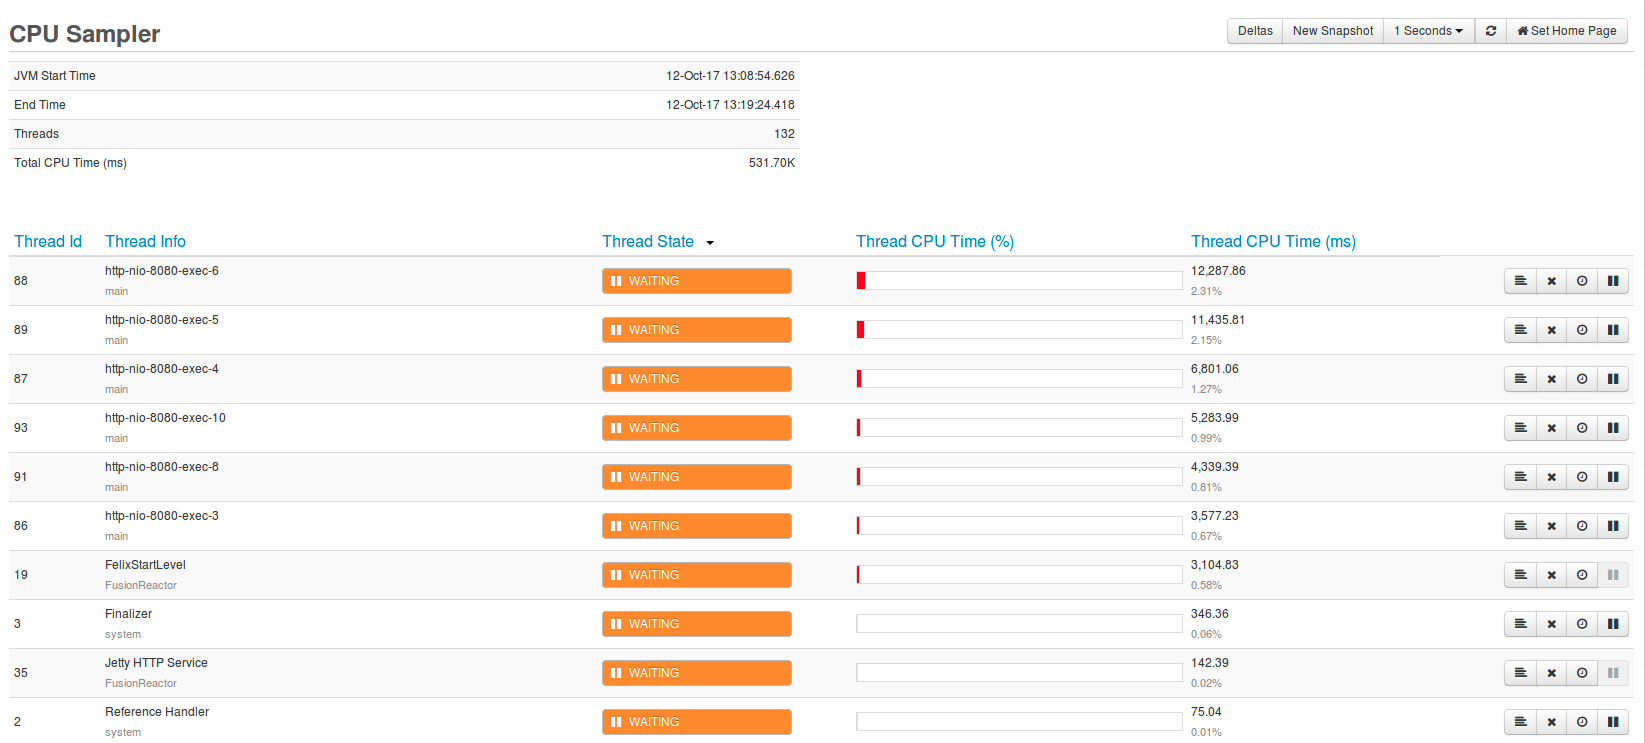
Sample information is given at the top left, this data relates to the current sample being processed:
- JVM Start Time: the time the Java Virtual Machine was initialized.
- Threads: the number of threads the sampler is currently watching.
- Total CPU Time (ms): The collective amount, to millisecond precision, of each thread's CPU time.
The Deltas button will render an aggregate of each thread's CPU time since the button was pressed until the last page refresh. The deltas feature is explained more under the Sampler section below.
The Snapshots button will create a real-time export of the Sampler for later inspection or comparisons, see CPU Snapshots for more about this.
Filtering
At the top right, the user is presented with a familiar tool: the filter table. Except this does not filter packages, it filters thread names. In the image above, the thread name Finalizer is added to the filter list. This means any thread with the name "Finalizer" will be omitted from the view.
Sampler
The sampler will retrieve all active threads and their CPU information since the Java Virtual Machine started. Alongside this, it will also render the live state the thread is in. This data will be updated at every page refresh.
The Deltas feature in the CPU Sampler is an incredibly useful feature. Once delta values are tracked, they can provide the user with the current CPU usage since the button was clicked till the current time. A reset button will appear once Deltas is pressed – clicking this button will allow you to set a new time (baseline) from where the thread CPU time is calculated.
To assess the performance of certain CPU-heavy threads the user can sort the table by highestThread CPUTime (%). The more expensive threads will then be filtered to the top. The Thread CPU Time % is the percentage of that particular thread's CPU usage against the total CPU time of all running threads. From there, users can take further action to speed up their server using preexisting FusionReactor tools, such as:
- Get a stack trace of the thread
- Kill the thread
- Profile the thread
- Pause the thread
Threads that are blocked will become highlighted on the page like the image below.

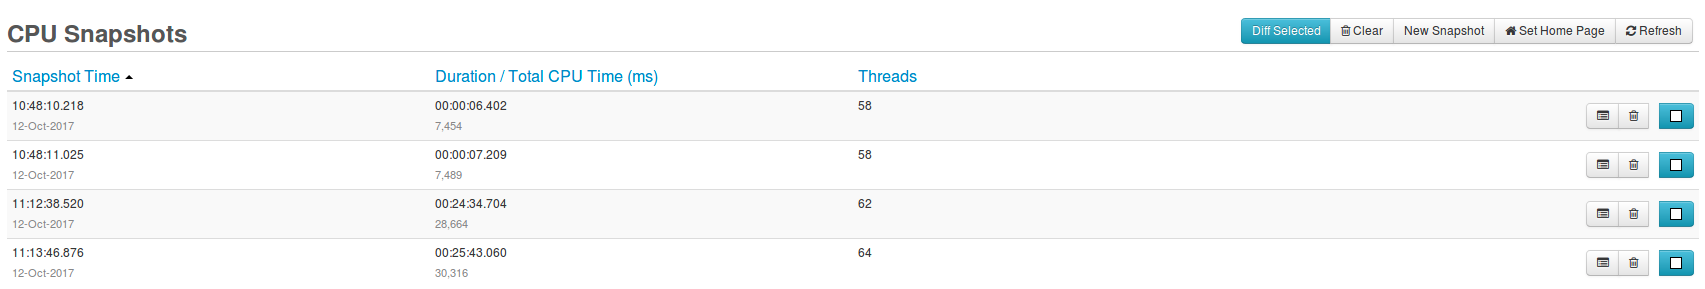
CPU Snapshots
Snapshots provide CPU Sampler information at the exact moment of capture. Multiple CPU Snapshots can be taken and stored in FusionReactor.
Snapshots can be taken at any moment during the execution of a sample, this is achieved by the 'Take Snapshot' button.
It is important to note: unlike the Heap View, these snapshots are volatile and are not stored on disk. This means restarting FusionReactor will lead to losing any cached snapshots.
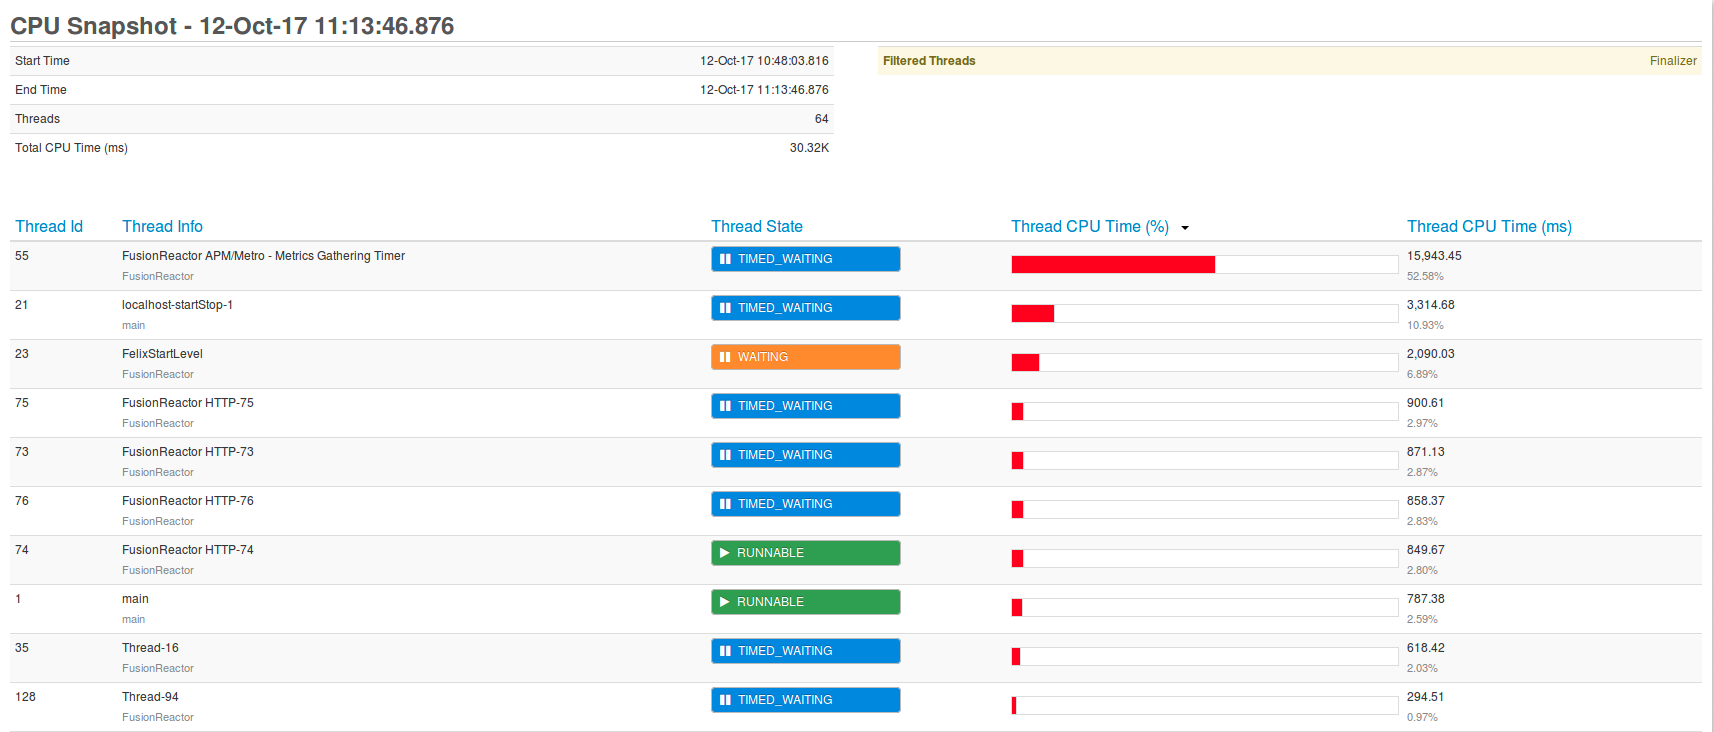
Snapshot View
By selecting to view a certain snapshot, you are redirected to a very familiar page. This page is essentially identical to the CPU Sampling page at the moment the snapshot was taken.
Diff View
To view compare two unique samples, select only two check-boxes on the CPU Snapshots page and click the 'Diff Selected' button. This will then generate the page shown below.

This is another helpful tool, as it can describe the changes in thread execution over a period of time. This page will render the inner-join difference between the left and right snapshots' threads.
Thread names can also be filtered on this page, just like the live CPU Sampler.
What am I looking at?
- The two selected snapshots are identified by either 'Left' or 'Right', they have their own respective columns and color scheme.
- The Left / Right Diffs table shows the general differences between snapshots e.g. differences in thread count between the left and right snapshot.
- On the right is the filters table.
- The table below then describes the change in CPU time between sampled threads.
The change in CPU time is very similar to the live deltas view in the CPU Sampler, however with this the user is not required to actively monitor the information. The user can take snapshots in different time periods and deviate from there any changes in thread time. For instance, lets say the left snapshot was taken two hours ago and the right was taken very recently, any threads that have a large delta value have had an increased processing load on the CPU.
Threads that have changed names between snapshots will be rendered with both names under Thread Name.
Troubleshooting
On certain machines, the CPU Sampler might return an error page like this:
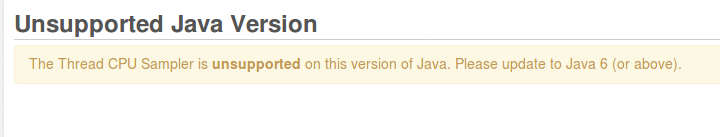
There are several cases where an error page will be returned:
- Unsupported Java Version – this is when FusionReactor is installed on a system with an unsupported Java Runtime Environment (anything below Java 6).
- Unsupported Java Management Extension – this is thrown when the JVM vendor does not support thread CPU timing. To fix this, run FusionReactor in a supported JVM.
-
Disabled Thread CPU Time – the sampler uses a Java Management Extension to capture a thread's special meta information. This error page is rendered when the thread CPU timing within this extension is disabled. This can be resolved by following these steps:
-
- Go to Metrics → JMX MBeans
- Click on java.lang
- Click on Threading
- Set the boolean value of ThreadCpuTimeEnabled to true
It is important to note that that performance in some Java Virtual Machine implementations could be affected by setting this parameter to true. This does not apply to the aforementioned Hotspot JVM.
CPU Sampler Settings
The CPU Sampler has its own configuration model under the CPU Sampler tab in Profiler Settings.
| Configuration | Description |
|---|---|
| Maximum Snapshot History | Refers to the maximum number of snapshots that can be stored on the CPU Snapshots page. |
| Reaching this limit will cause earlier snapshots to be deleted. | |
| UI Row Limit | For increased performance, this configurations limits the number of rows rendered on the CPU Sampling page to the given value. |
| Information that has exceeded this limit will not be displayed. There will be a small message under the CPU Sampling table to notify the user that information might have been clipped. | |
| Exclude Thread Names | Will exclude any threads from the sample result that match the given parameters. |
| Threads that are not required to be included in the sampler can be added to this list. | |
| Creating a new line or adding a comma will separate thread names. |