ColdFusion Metrics
ColdFusion Metrics are only available for certain ColdFusion versions and under certain server configurations.
Learn more
The ColdFusion Metrics page is used to display various details specifically for ColdFusion servers. Much this information is retrieved from the ColdFusion built-in Profiler and helps to understand the true state of your server traffic.
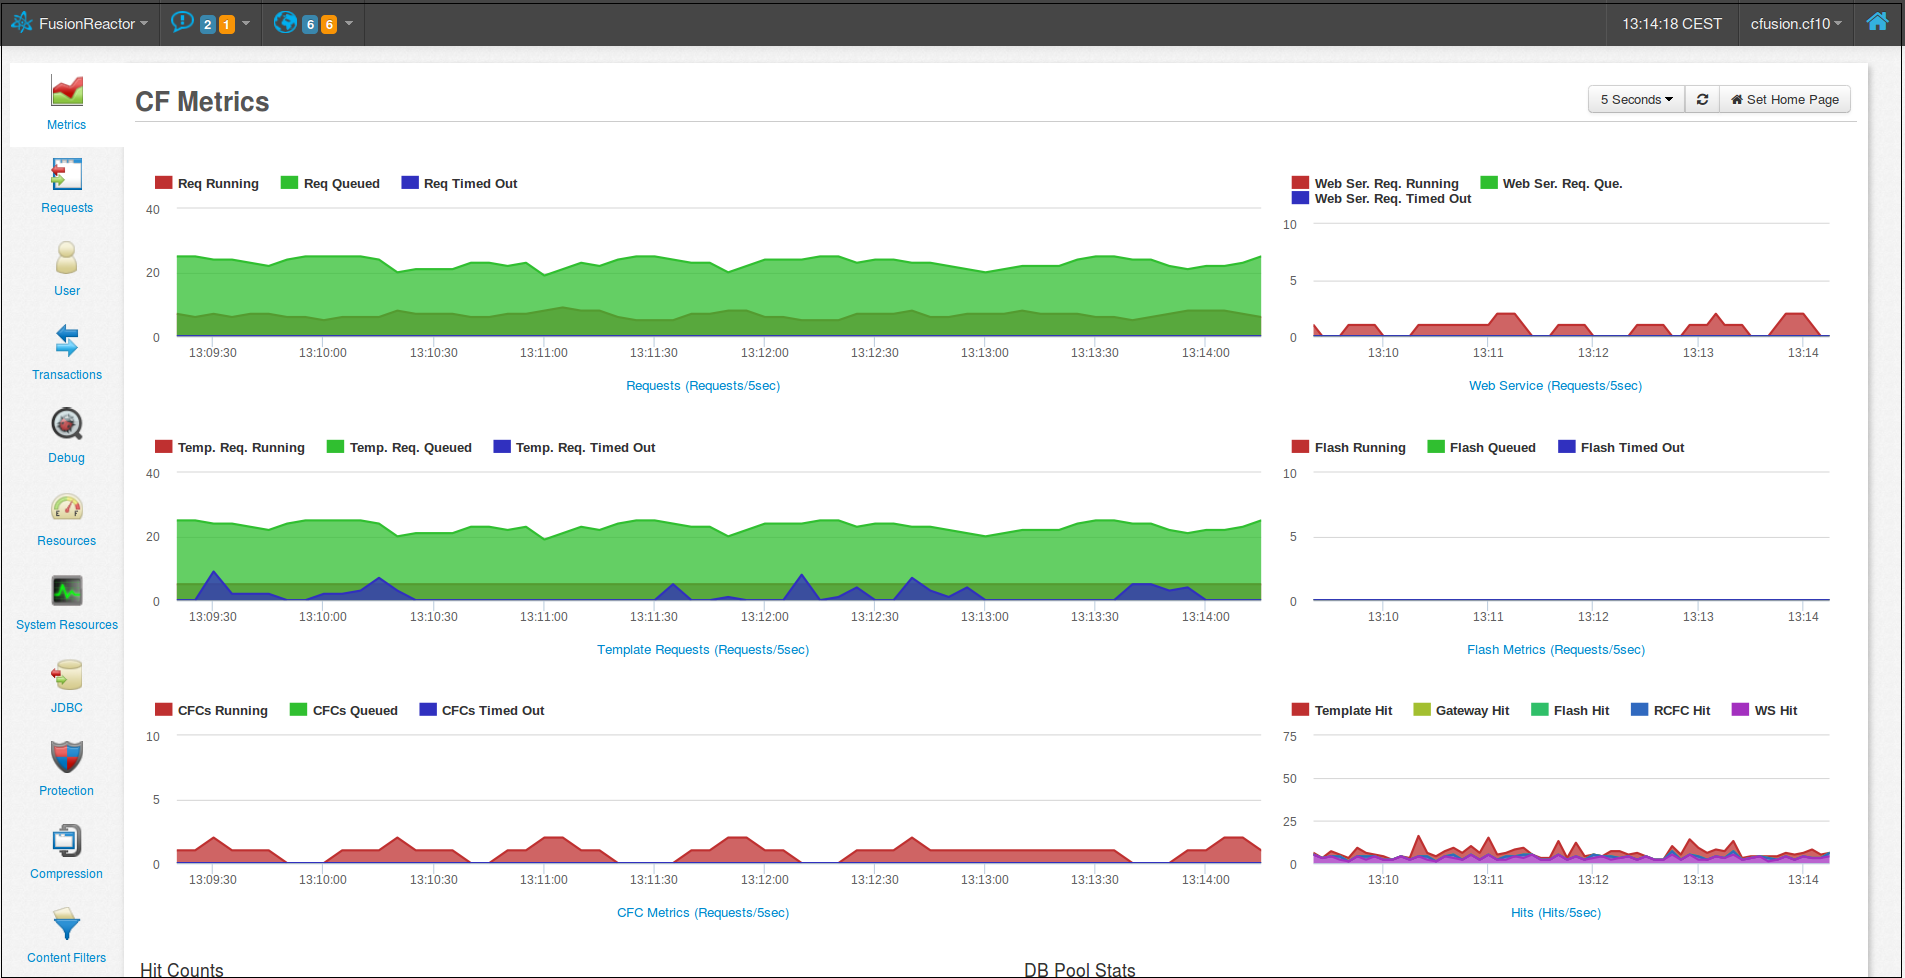
Graphs
There are six graphs on the ColdFusion Metrics page. All graphs - apart from the Hits Graph - have three series:
- Running: Any currently active requests at the given point in time.
- Queued: Any requests currently queued for processing.
- Timed Out: Any requests that took too long and therefore were timed out.
These are described below:
| Graph Name | Description |
|---|---|
| Requests | Information about requests. This has 3 series for different request outcomes. |
| Web Service | Statistics on Web Service Requests. This has 3 series for different web service states. |
| Template Requests | Statistics on Template Requests. This has 3 series for different web service states. |
| Flash Metrics | Statistics on Flash Requests. This has 3 series for different flash requests states. |
| CFC Metrics | Statistics on ColdFusion Components. This has 3 series for different CFC states. |
| Hits | The number of requests of all types, over a given timespan. These are filtered by |
| series for the requests in the above graphs. |
Hit counts
The hit counts table gives an overview of how frequently different types of requests are being sent.
The table has the following fields:
| Field | Description |
|---|---|
| Flash | Number of hits of Flash requests. |
| Template | Number of hits Template requests. |
| Gateway | Number of hits of Event Gateway requests. |
| RCFC | Number of hits of RCFC (Remote ColdFusion Component) requests. |
| WebServices | Number of hits of Web Service requests. |
| Total | The sum of all the request types. |
DB Pool Stats
DB Pool Stats gives an overview of the state of the database pool. The database pool caches database connections so that they can be reused in future requests, reducing processing time.
The DB Pool Stats table has the following fields:
| Field | Description |
|---|---|
| DSN | The Data Source Name of the statistic. |
| Open | The number of currently open cache database connections. |
| Avg Open | The average number of connection checked out from the pool over time |
| Total | The total number of connection in the pool (includes both available and connections in use). |
| Avg Total | The average Total connection in the pool over time. |
| Max | The maximum possible connections configured for this data source. |
Need more help?
Contact support in the chat bubble and let us know how we can assist.