FusionReactor ColdFusion Plugin
The FusionReactor ColdFusion Plugin for FusionReactor works with ColdFusion Standard AND Enterprise (version 8+) and extends FusionReactor to enable capture of the CF event, server and application logs, as well as real-time stats.
The real-time statistics consist of 40 new metrics including:
- Active Sessions - number of current sessions
- Application / Server / Scope Size
- Hit Counts (breakdown of hits per request type)
- DB Pool Stats (detailed metrics for datasources)
which increase the amount of information that FusionReactor generates when dealing specifically with ColdFusion servers. This information is delivered to you via log files which can be used to create detailed analysis of your server.
The following log files are captured by the FusionReactor ColdFusion Plugin:
As of FusionReactor 6 we have added some graph pages to the user interface to visualise the gathered data.
In comparison to FusionReactor 4.x, the ColdFusion Plugin is now included as standard as opposed to being separately installed as the FusionReactor Extensions for ColdFusion (FREC). If you have upgraded a FusionReactor 4.x instance to FusionReactor 6, you may see an error on startup regarding JAR sealing. This is due to packages in the ColdFusion Plugin being present twice on the classpath. If you see this error you should ensure that you remove FREC from your ColdFusion instance. Please consult the following pages for directions on this:
Logs
CF Stats
CF Database Connection Statistics (dbpoolstats.log)
Note
It is important that you enable Monitoring and Profiling in ColdFusion, to do this check out ColdFusion Settings Section in Enable and Configure the FusionReactor ColdFusion Plugin guide.
This log (dbpoolstats.log) lists the data sources, whether an application on the ColdFusion server is using the data source and the number of connections. Below is a table explaining each of the attributes in the log.
| Field Name | Number | Description |
|---|---|---|
| Date (Formatted) | 1 | The date on which this log entry was written. |
| Time (Formatted) | 2 | The time on which this log entry was written. |
| Date/Time that the request was made (Milliseconds) | 3 | This is the millisecond time at which this request was made. |
| Get Log Version | 4 | This is the version of the log file. |
| Date/Time that FusionReactor stated (Milliseconds) | 5 | The time that the instance of FusionReactor (that is running the plugin) started. |
| Average Open Connection Count | 6 | The average number of open connections that are in the pool since it was last reset. |
| Average Total Connection Count | 7 | The average number of connections that are in the pool since it was last reset. |
| DNS (Data Source Name) | 8 | The name of the data source. |
| Maximum Number of Connections | 9 | The max amount of connections that the pool may hold. This value is -1 if not configured. |
| Number of open Connections | 10 | The amount of connections that are currently open. |
| Total Connection Count | 11 | The amount of connections that are currently in the pool. |
CF Hit Count
CF Hit Count Statistics (hitcountstats.log)
Note
It is important that you enable Monitoring and Profiling in ColdFusion, to do this check out ColdFusion Settings Section in Enable and Configure the FusionReactor ColdFusion Plugin guide. Below is a table explaining each of the attributes in the log.
This log (hitcountstats.log) stores hit count related information. Below is a table explaining each of the attributes in the log.
| Field Name | Number | Description |
|---|---|---|
| Date (Formatted) | 1 | The date on which this log entry was written. |
| Time (Formatted) | 2 | The time on which this log entry was written. |
| Date/Time (Milliseconds) | 3 | This is the millisecond time at which this request was started |
| Get Log Version | 4 | This is the version of the log file. |
| Date/Time that FusionReactor stated (Milliseconds) | 5 | The time that the instance of FusionReactor (that is running the plugin) started. |
| Template Hit Count | 6 | The number of hits by a regular HTTP template request. |
| Delta Template Hit Count | 7 | The difference between the current template hit count and the previous template hit count. |
| Gateway Hit Count | 8 | The number of hits by a gateway. |
| Delta Gateway Hit Count | 9 | The difference between the current gateway hit count and the previous gateway hit count. |
| Flash Hit Count | 10 | The number of hits by Flash Remoting. |
| Delta Flash Hit Count | 11 | The difference between the current flash hit count and the previous flash hit count. |
| RCFC Hit Count | 12 | The number of hits from HTTP calls to CFC functions. |
| Delta RCFC Hit Count | 13 | The difference between the current RCFC hit count and the previous RCFC hit count. |
| WebService Hit Count | 14 | The number of hits from web services. |
| Delta Web Service Hit Count | 15 | The difference between the current web services hit count and the previous web services hit count. |
| Total Hit Count | 16 | The total hit count |
| Delta Total Hit Count | 17 | The difference between the current total hit count and the previous total hit count. |
| Delta Capture Time (milliseconds) | 18 | The difference between the current capture time and the previous capture time. |
Note
In the fields titled "Delta" the definition describes it as "The difference between". This means the difference between the current data sample and the previous, for example if the current was 10 and the previous was 8 then the delta would be 2 (10 - 8).This sort of information is useful for spotting trends.
CF Log
CF Log Entries (fr-coldfusion-log.log)
The fr-coldfusion-log will capture a copy of ColdFusion log entries,
for example when making a call to <cflog>. This log file will be
appended to every time a CF Log event occurs.
The following table describes the captured information.
| Field Name | Number | Description |
|---|---|---|
| Date (Formatted) | 1 | The date on which this log entry was written. |
| Time (Formatted) | 2 | The time on which this log entry was written. |
| Name of the logger | 3 | The name of the logger of the event. |
| Level | 4 | The level, priority, of the logging event. |
| Message | 5 | The message of the logging event. |
Example :
The file testFrec.cfm contains the following:
1 | |
By running this page a fr-coldfusion-log.log is created, containing
the following log entry:
1 | |
CF Realtime
CF Realtime and Request Stats (realtimestats.log)
Note
It is important that you enable Monitoring and Profiling in ColdFusion, to do this check out ColdFusion Settings Section in Enable and Configure the FusionReactor ColdFusion Plugin guide.
This log (realtimestats.log) stores real time related information relating to currently active requests. Requests include browser requests, CFC HTTP requests, web services, gateways, and Flash remoting.
The log entries are updated every 5 seconds. Below is a table explaining each of the attributes in the log.
| Field Name | Number | Description |
|---|---|---|
| Date (Formatted) | 1 | The date on which this log entry was written. |
| Time (Formatted) | 2 | The time on which this log entry was written. |
| Date/Time (Milliseconds) | 3 | This is the millisecond time at which this request started. |
| Get Log Version | 4 | This is the version of the log file. |
| Date/Time that FusionReactor stated (Milliseconds) | 5 | The time that the instance of FusionReactor (that is running the plugin) started. |
| Active Session Count | 6 | The current amount of sessions on the server. |
| Application Scope Size (bytes) | 7 | The size of the application. |
| Average Response Time (milliseconds) | 8 | The average server response time. |
| Cached Query Count | 9 | The number of queries that are stored in cache. Requires cached query monitoring to be enabled either via system property or configuration. |
| CFC Requests Queued | 10 | The number of CFC requests (Sent via HTTP) that were queued and are waiting to run. |
| CFC Requests Running | 11 | The number of CFC requests (Sent via HTTP) that are currently running. |
| CFC Requests Timed Out | 12 | The number of CFC requests (Sent via HTTP) that were timed out whilst waiting to run. |
| CF Thread Queued | 13 | The number of CF threads that are queued. NOTE : Value currently set at ZERO |
| CF Thread Running | 14 | The number of CF threads that are running. |
| Concurrent User Count | 15 | The number of users that logged in using the "CFLOGIN" tag. |
| Flash Remoting Request Queued | 16 | The number of Flash Remoting Requests that are queued and waiting to run. |
| Flash Remoting Request Running | 17 | The number of Flash Remoting Requests that are running. |
| Flash Remoting Request Time out | 18 | The number of Flash Remoting Requests that were timed out whilst waiting to run. |
| JVM Free Memory (bytes) | 19 | The free memory in the Java Virtual Machine. |
| JVM Used Memory (bytes) | 20 | The memory used by the Java Virtual Machine. |
| Query Cache Hit Ratio | 21 | The query cache hit ratio. Requires cached query monitoring to be enabled either via system property or configuration. |
| Query Cache Size (bytes) | 22 | The size of the cache. Requires cached query monitoring to be enabled either via system property or configuration. |
| Requests Queued | 23 | The number of request threads queued (JRun). |
| Requests Running | 24 | The number of requests that are running (JRun). |
| Requests Timed Out | 25 | The number of request timeouts (JRun). |
| Request Load | 26 | Request load of the server, displayed as requests per a second. |
| Server Scope Size (bytes) | 27 | The server scope size. |
| Session Scope Size (bytes) | 28 | The size of the session scope. |
| Template Cache Count | 29 | The number of templates stored in the template cache. The template cache is where ColdFusion stores compiled CFM and CFC templates in memory. When a template is executed for the first time, it is compiled to Java bytecode, and then stored in the template cache. As long as the template is unchanged, ColdFusion uses the compiled form of the template stored in the template cache. |
| Template Cache Hit Ratio | 30 | The hit ratio of the template cache. The cache-hit ratio indicates the number of cache hits in relation to the number of cache misses |
| Template Cache Size (bytes) | 31 | The total size of the template cache. |
| Template Requests Queued | 32 | The number of template requests that are queued and waiting to run. |
| Template Requests Running | 33 | The number of template requests that are running. |
| Template Requests Timed Out | 34 | The number of template requests that have timed out. |
| Throttle Queue Size | 35 | The total number of requests queued in the request throttle. Requests are throttled when ColdFusion queues them, because not enough total memory is available to handle them. Requests smaller than the specified limit are not queued or counted as part of the total memory. Requests larger than the specified limit are counted as part of total memory and are queued if the request throttle-memory size of the request is exceeded. |
| Total Throttle Memory Used (bytes) | 36 | The total amount of memory that has been used by the throttle. |
| Web Service Requests Queued | 37 | The number of Web Services that are queued and waiting to run. |
| Web Service Requests Running | 38 | The number of Web Services requests that are currently running. |
| Web Service Requests Timed Out | 39 | The number of Web Services that timed out whilst waiting to run. |
| Memory Monitor State | 40 | If Memory Monitoring is enabled in ColdFusion then this value will be 1, if not it will be 0. To enable this check out: Enable and Configure the FusionReactor ColdFusion Plugin |
| Profiling State | 41 | If Profiling is enabled in ColdFusion then this value will be 1, if not it will be 0. To enable this check out: Enable and Configure the FusionReactor ColdFusion Plugin |
More detailed information relating to these metrics can also be found within the Adobe ColdFusion documentation.
Enabling
You may have to turn on specific monitoring within the ColdFusion Server Monitor in order to see some aspects of the information in the CF Metrics and CF System Metrics pages, and in some columns of the realtimestats log file. See below how to enable the different monitoring levels within the ColdFusion Server Monitor. If a required level is not enabled, data for that element will show as zero in the user interface, as well as in any corresponding log column, to ensure each log line remains complete.
ColdFusion Settings
In order for FusionReactor to collect certain data from ColdFusion, you must enable the ColdFusion settings described below.
- Enable Monitoring - This is needed to monitor the counts of running, queued, and timed out requests and CF threads, as well as 'Hit Counts'
In ColdFusion 2018 there is no option to enable / disable monitoring. This metric is available by default and no action is required.
- Enable Memory Tracking - This is needed to monitor 'Scope Sizes' and 'Throttled Memory Usage'
Memory Tracking has been known to cause ColdFusion servers to hang or crash. Please only enable this feature when absolutely necessary, and only for as long as you need to.
In ColdFusion 2018 it is not possible to enable memory monitoring
These settings can be enabled in the ColdFusion Administrator for ColdFusion 9 - 2016, in the section 'Server Monitoring' and its 'Monitoring Settings' page.
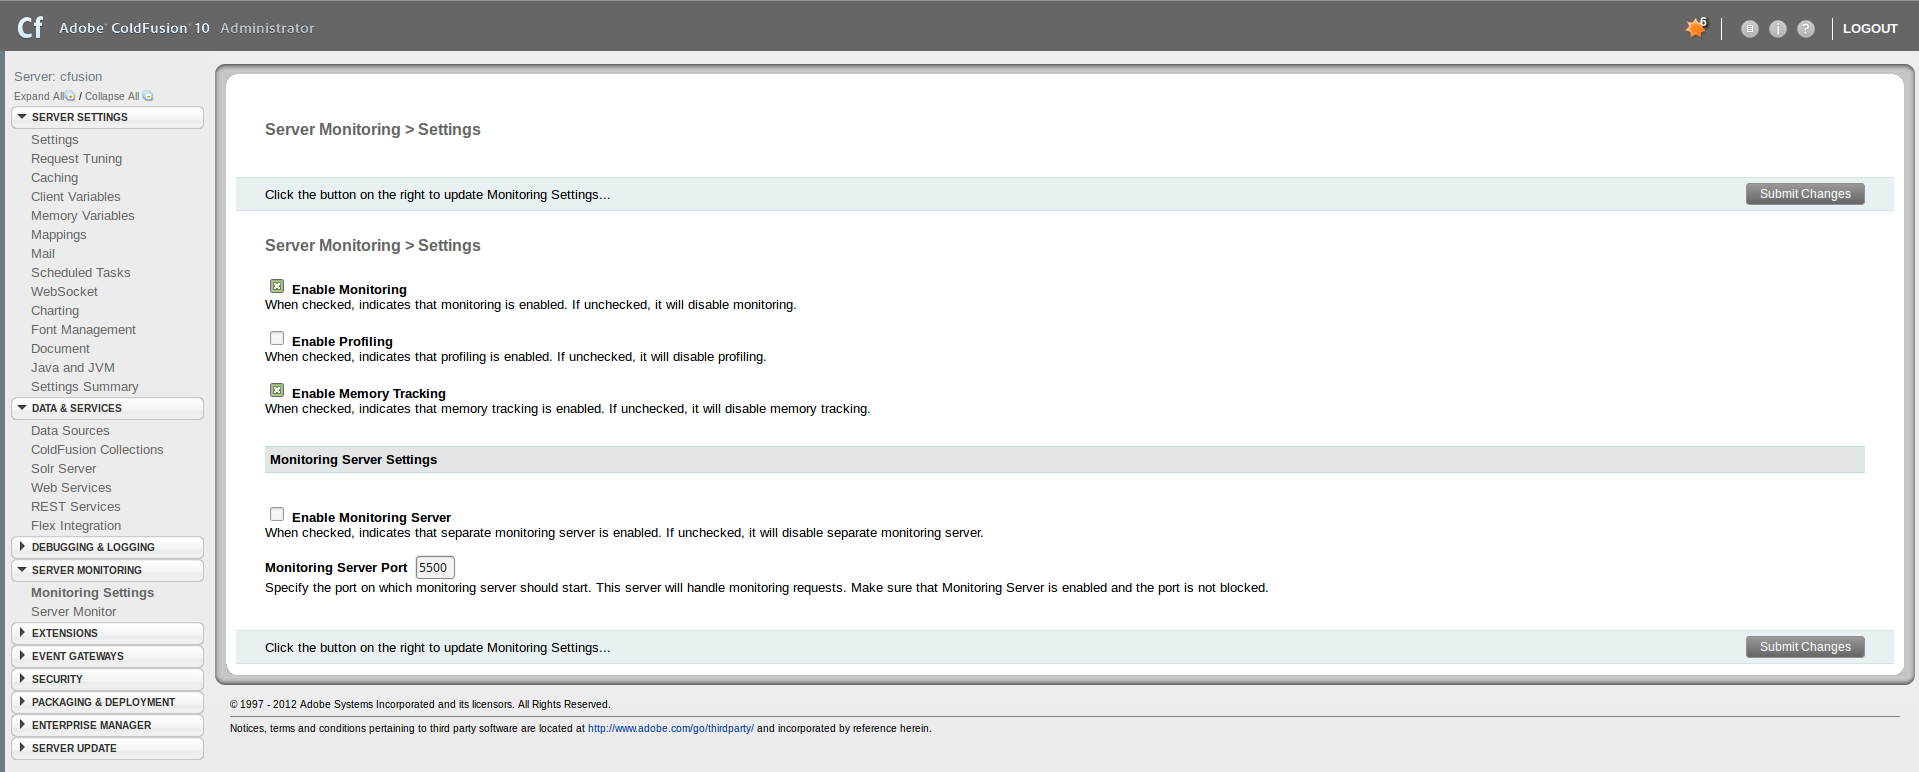
Alternatively, the settings an be enabled at the top of the ColdFusion server monitor itself.
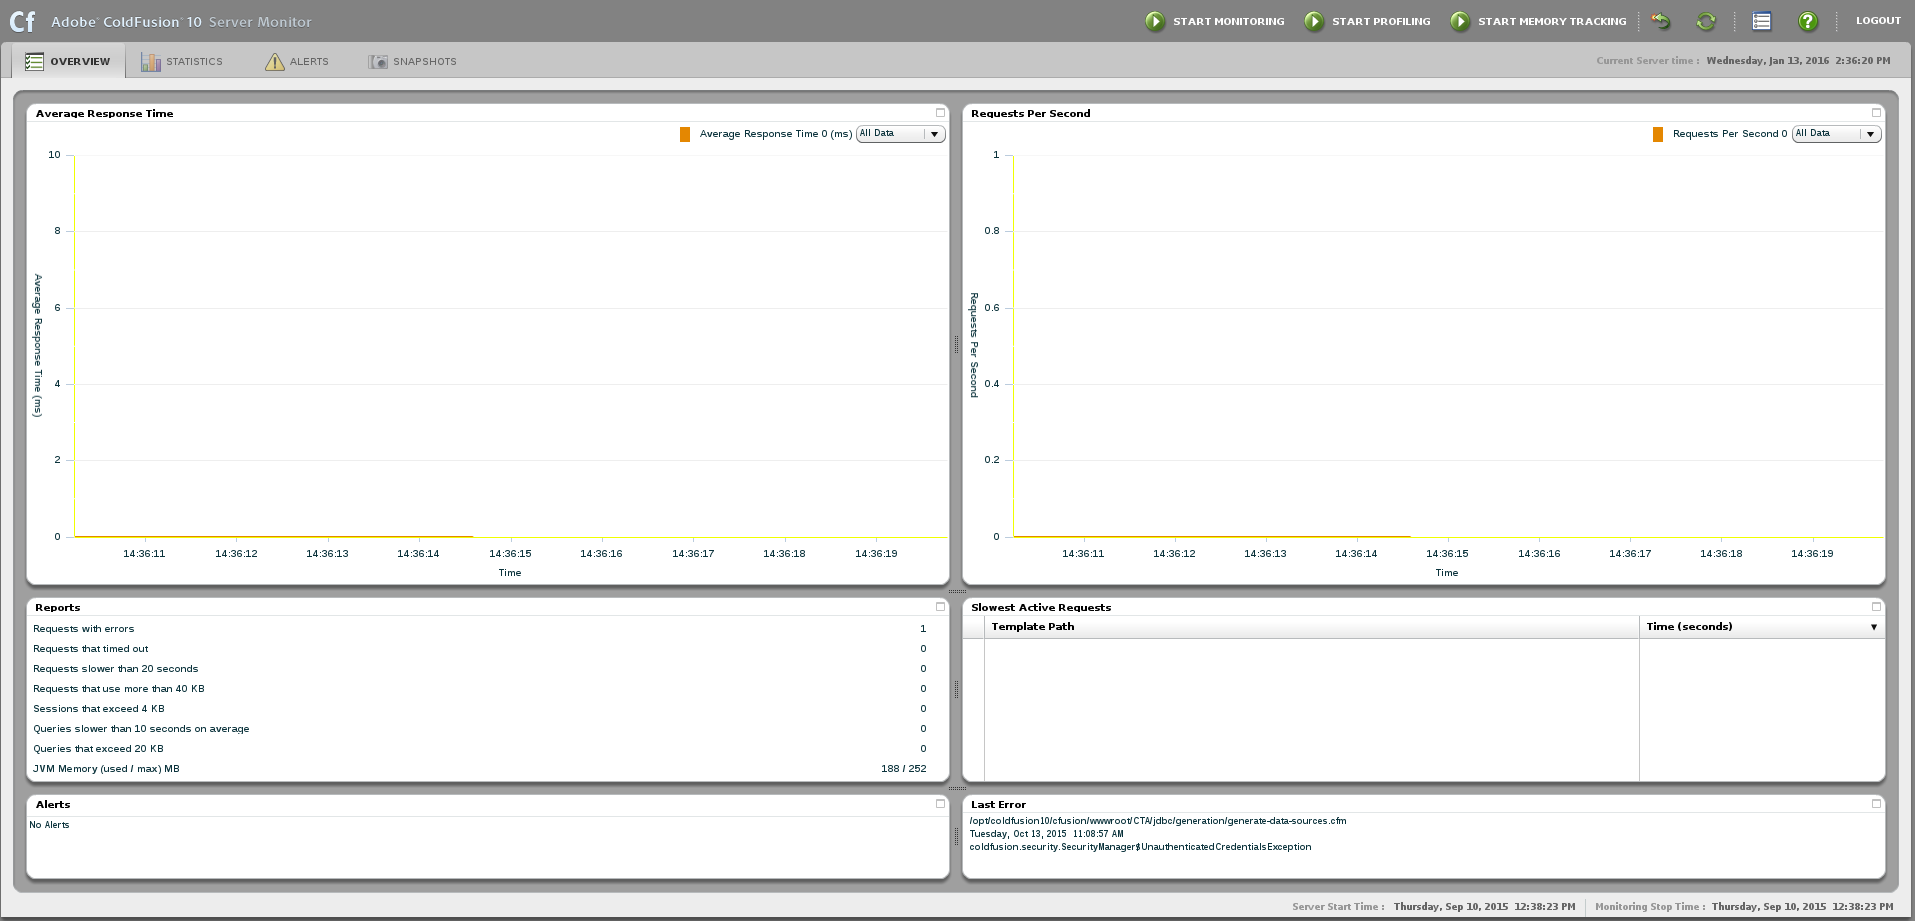
If running ColdFusion 9.0 or earlier, you can only enabled the settings via the monitor itself.
Configuration
The FusionReactor ColdFusion Plugin can be configured for each FusionReactor instance. Navigate to the "Active Plugins", or "All Plugins", pages available in the "Plugins" menu item in the (top-left) FusionReactor menu.
In the list of plugins, locate the plugin named "FusionReactor ColdFusion Plugin", see Figure 1.

Figure 1: To Configure the FusionReactor ColdFusion plugin, click the button 'Configuration'.
The following configurations options are available :
| Configuration | Description |
|---|---|
| Create a copy of ColdFusion Log Entries (Available in ColdFusion 8+) |
When enabled, the Plugin will save a copy of the ColdFusion log entries (such as calls to fr-coldfusion-log.log |
| Create a log of the ColdFusion Server Monitor Data (Available only in ColdFusion 8+) |
When enabled, the Plugin will save selected ColdFusion Server Monitor Data to the following log files located in the FusionReactor instance's log directory. dbpoolstats.log hitcountstats.log realtimestats.log Hit count stats are not available in ColdFusion 2018 (Initial release version) but are available from update 1 or greater. |
| Graph the CF Server Monitor Metrics (Available only in ColdFusion 8+) |
When enabled, the Plugin will graph the CF Server Monitor Metrics into the graphs on CF Metrics and CF System Metrics pages. |
| (Not Recommended) Monitor CF 2021 Requests and HitCounts (Available only in ColdFusion 2018+) |
When enabled, the Plugin will monitor CF 2021 Request and HitCounts. For any requests that happen whilst disabled, the metrics will be lost. |
| (Not Recommended) Monitor CF 2018/2021 Memory (Available only in ColdFusion 2018+) |
When enabled, the Plugin will monitor CF 2018/2021 memory. |
| Monitor CF 2018/2021 Cached Query Stats (Available only in ColdFusion 2018+) |
When enabled, the Plugin will monitor CF 2018/2021 cached query stats. There may be issues when using Redis or Memcached as the caching engine. |
| (Not Recommended) Monitor CF 2018/2021 Cached Query Stats Per Application (Available only in ColdFusion 2018+) |
When enabled, the Plugin will monitor CF 2018/2021 cached query stats per app. Requires monitoring cached query stats to be enabled too. Always fully refresh the graph page for up-to-date stats. There may be issues when using Redis or Memcached as the caching engine.. |
| Track CFML Line Execution Times (Available only in ColdFusion 8+) |
When enabled, the Plugin records line level execution time data for every line of CFML code executed. Please note that this feature could HEAVILY impact the performance of running applications. Also note that the feature relies on line number information generated by ColdFusion, which is known to have some inaccuracies and is beyond our control. We therefore CANNOT guarantee the accuracy of the tracked information. |
These log files will be included in the Centralized Log Rotation, which archives and pushes log files to FusionAnalytics.
Click the 'Save Configuration' button to save the configuration, changes will be applied immediately.