Sessions
User Sessions shows two graphs of the following data points :
- Created Sessions
- Destroyed Sessions
- Rejected Sessions
- Active Sessions
Below is a sample image of the User Sessions page with little data shown.
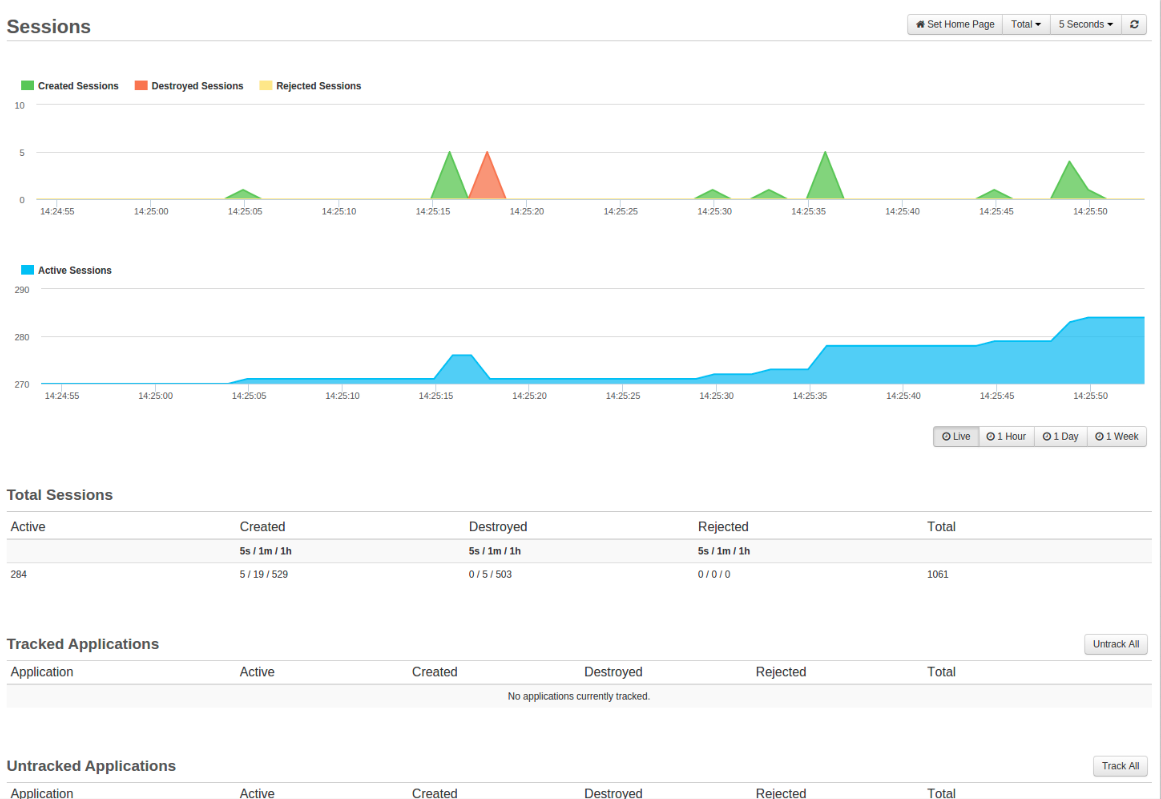
Sessions Graph
Both of these graphs use the standard set of aggregations to show the values over the last hour, day of week.
On this page you'll see two graphs.
The first graph contains the following series:
- Created Sessions: Green
- This value shows how many user sessions have been created
- Destroyed Session: Orange
- This value shows how many user sessions have been destroyed
- Rejected Sessions: Yellow
- This value shows how many user sessions have been rejected
The second graph only contains a single series:
- Active Session: Blue
- This value shows how many user sessions are currently active
Placing your mouse pointer on a data point within the first graph will show a tool-tip with details about that sample, including:
- Date and time of the sessions
- Created Sessions
- Destroyed Sessions
- Rejected Sessions
On the second graph will show :
- Date and time of the session
- Active Sessions
When browsing the 1 Hour, 1 Day, and 1 Week activity graphs you are able to select time frames by using the slider under the graph. To pinpoint specific days, times and spikes your user experiences.
- 60 seconds at 1 second
- 1 Hours at 5 seconds
- 1 Day at 1 minute
- 1 Week at 1 hour
Tip
On the page in the top right, next to the refresh option, you are able to filter between different tracked applications.
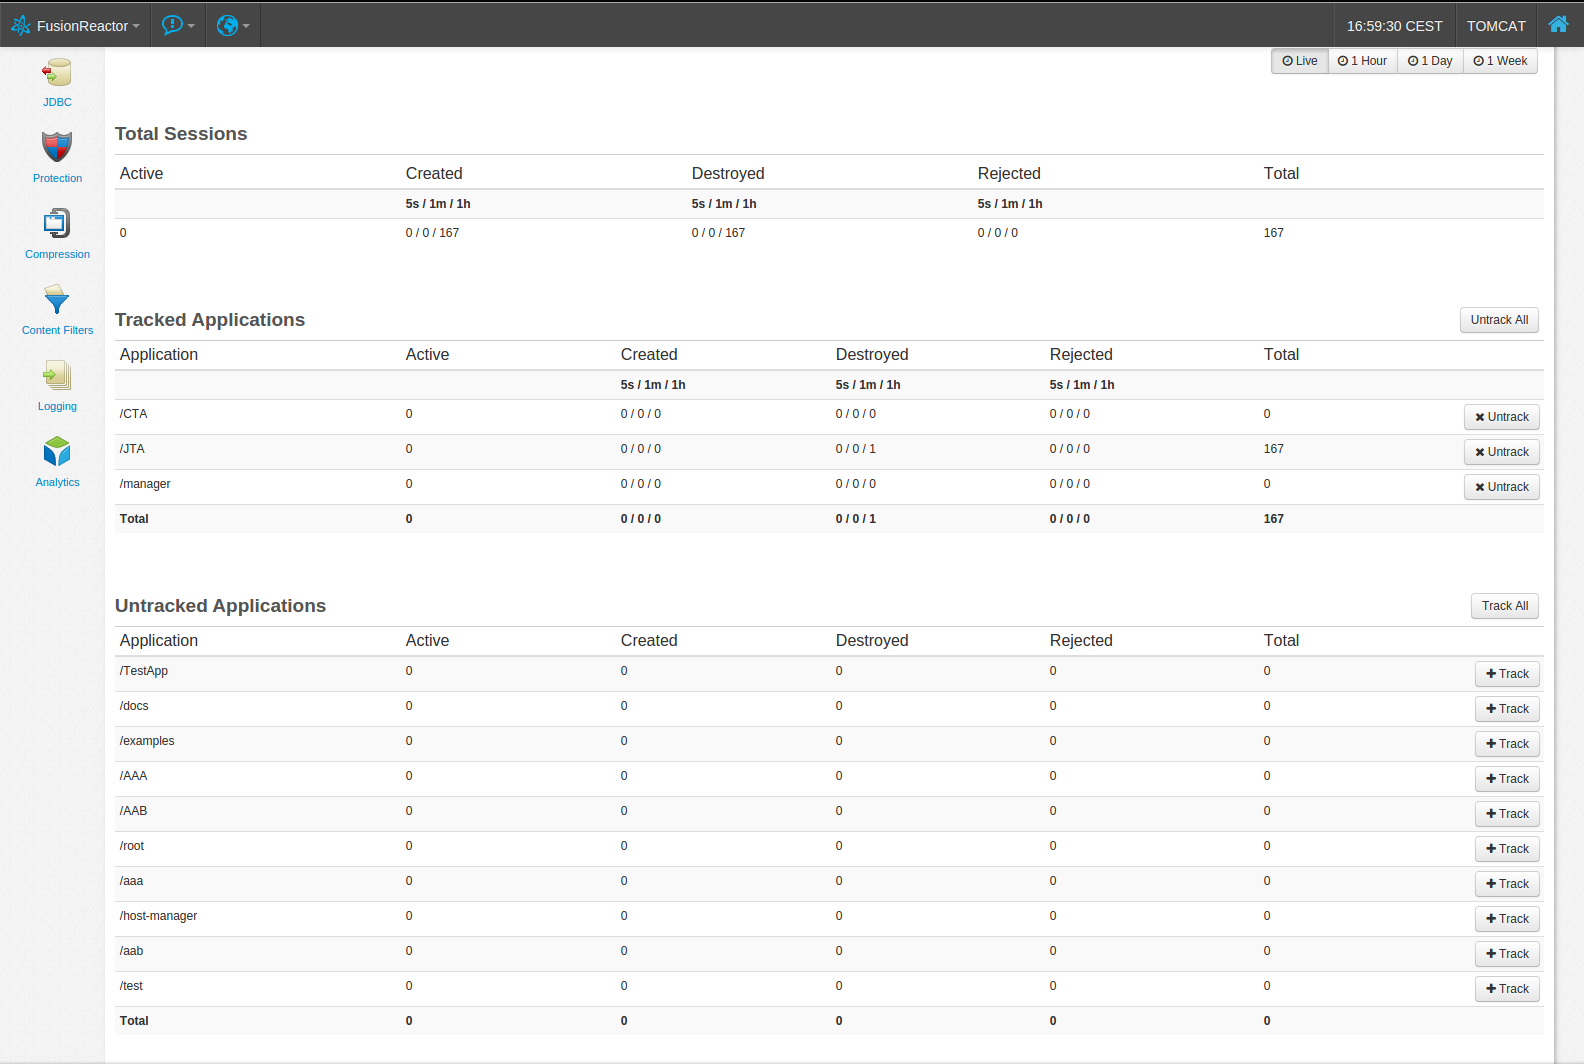
Total Sessions
The Total Sessions table shows the values for all sessions on the server, these values are tracked for all applications (even if they are not tracked)
- The current number of active sessions.
- Created sessions within the last 5 seconds, 1 minute, and 1 hour.
- Destroyed sessions within the last 5 seconds, 1 minute, and 1 hour.
- Rejected session within the last 5 seconds, 1 minute, and 1 hour.
- Total sessions created since the server started.
Tracking Applications
As it's possible to have many applications running on a single application server FusionReactor will not automatically track each application into a graph series. This is intended to save memory; however, it is possible to tell FusionReactor to create a graph series for any single application or for all applications.
The last section of this page is used to give an overview of all tracked and untracked applications. The tracked application can be seen in the Tracked Applications table, and are broken down in the same way as the Total Sessions table.
Here, each application can be quickly untracked by clicking the Untrack button. This removes the graph series and stop tracking sessions for this application.
In the Untracked Applications table you can still see the session values for each application; however, the values for active, create, destroyed, rejected are 'live' values and only show the sessions affected in the last second. The total value is still the total sessions created for that application since the server started.
Tip
clicking the Track button, creates a graph series for the application, and moves the entries to the Tracked Applications table.
Info
In order to have tracked applications the settings Enable and Track Session Per Application need to be enabled in the User Settings.
Need more help?
Contact support in the chat bubble and let us know how we can assist.