JMX MBeans
FusionReactor's JMX functionality (JMX MBeans, JMX MBean Overview, JMX MBean Graphs, and AWS CloudWatch Metrics) are available in FusionReactor Enterprise Edition and Ultimate Edition (both on-premise and Cloud license types) only.
Introduction
Java Management Extensions - Management Beans are a technology introduced into the Java language in version 5.0.
The JMX MBean system is a mechanism whereby the internals of a software application can be exposed in a controlled, standard way. Users with suitable software can then inspect and (in some cases) change these values. An MBean-instrumented application can also allow a connected client to trigger certain operations and be notified when values change.
FusionReactor 7 adds support for reading and writing most types of JMX bean data.
Info
Triggered operations and value notifications are not yet supported.
JMX MBeans view
Found in Metrics > JMX MBeans.
The JMX MBeans view consists of a tree representation of the current JMX hierarchy on the left, and tab panes for attributes and metadata on the right.
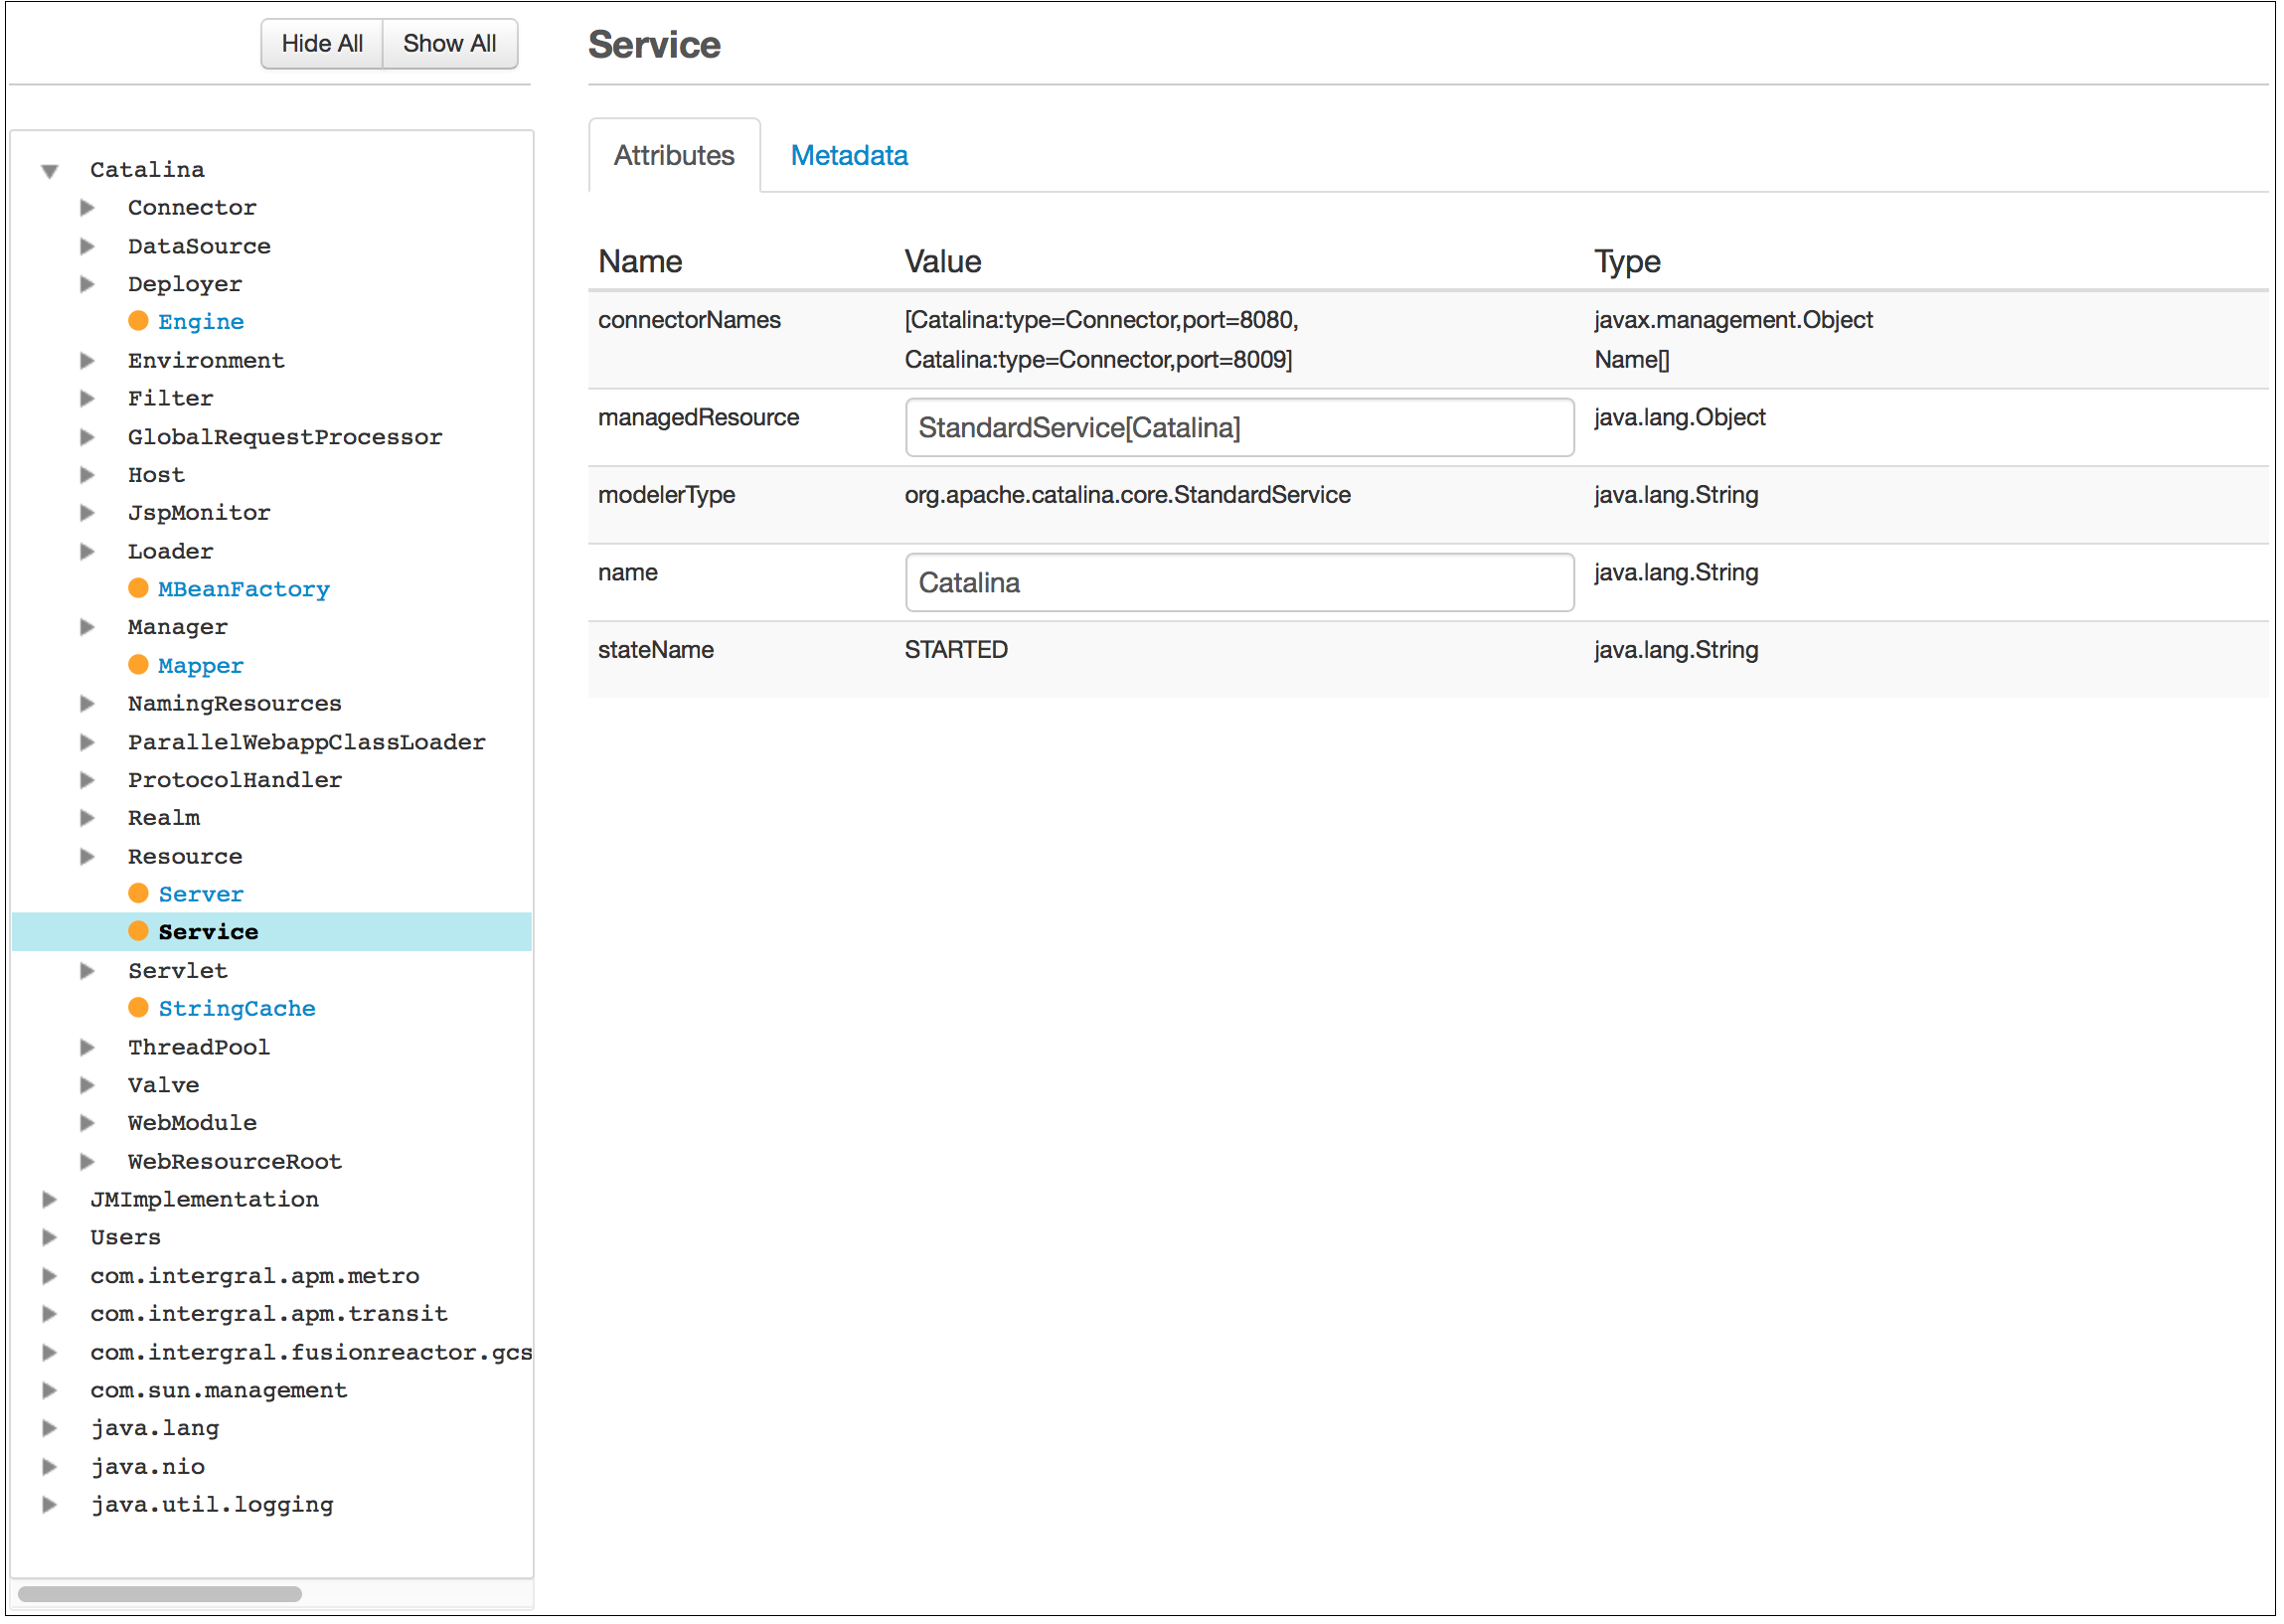
The tree can be unfolded to drill down through the hierarchy of JMX services. Where an object supports instrumentation, it is colored blue with an orange bullet. Clicking this link causes the objects attributes and metadata to be retrieved and displayed.
The tree can be fully hidden and revealed using the Hide All and Show All buttons.
The Show All button recursively retrieves and opens the JMX instrumentation hierarchy for the tracked server.
Note
This can take significant time for production Java applications.
Attributes
Attributes for the selected MBean are displayed in a table:
| Name | Description |
|---|---|
| Name | This is the JMX-registered name of the attribute. These are often represented as camelCase variable names. |
| Value | The current value of the variable. If the value is not a simple type, FusionReactor attempts to display it in a logical way (arrays, for instance, are shown in square brackets). Where values are marked by the JMX instrumentation as changeable, these are shown as editable. Press Return to commit these values back to the server. It is not recommended to change JMX-instrumented values unless you are familiar with the effects of the change. Often, software engineers provide this functionality as an internal test mechanism; changing these values 'beneath' the software application can have unintended consequences. |
| Type | This is the Java type of the tracked object. |
JMX MBean tracking
FusionReactor is able to track and graph JMX values over time. Simple numeric values can be tracked, and these are displayed in the Attributes tab with a Play icon: :fa-play:
Once clicked, FusionReactor begins periodic sampling of the value. The stored data can be displayed in Metrics > JMX Bean Graphs. A new button cluster replaces the play icon:
From left to right, the functionality presented is as follows:
| Functionality | Description |
|---|---|
 |
Displays the FusionReactor graph associated with this tracked data. |
 |
Instructs the FusionReactor AWS CloudWatch Metrics system to begin transferring this metric to CloudWatch. When Clicked, a dialog requests the CloudWatch Dimensions to be used for this series (see AWS CloudWatch Metrics). The Play icon changes to a Stop icon to indicate this metric is being transferred to CloudWatch. Click this button again to stop transferring this value to CloudWatch. |
 |
Removes this value from all FusionReactor tracking. |
Metadata
Attributes for the selected MBean are displayed in a table. Metadata is listed for the bean itself (MBeanInfo) and each attribute exposed by that bean (MBeanAttributeInfo).
JMX MBean Overview
The MBean Tracking Overview provides a list of all attributes currently tracked by FusionReactor.
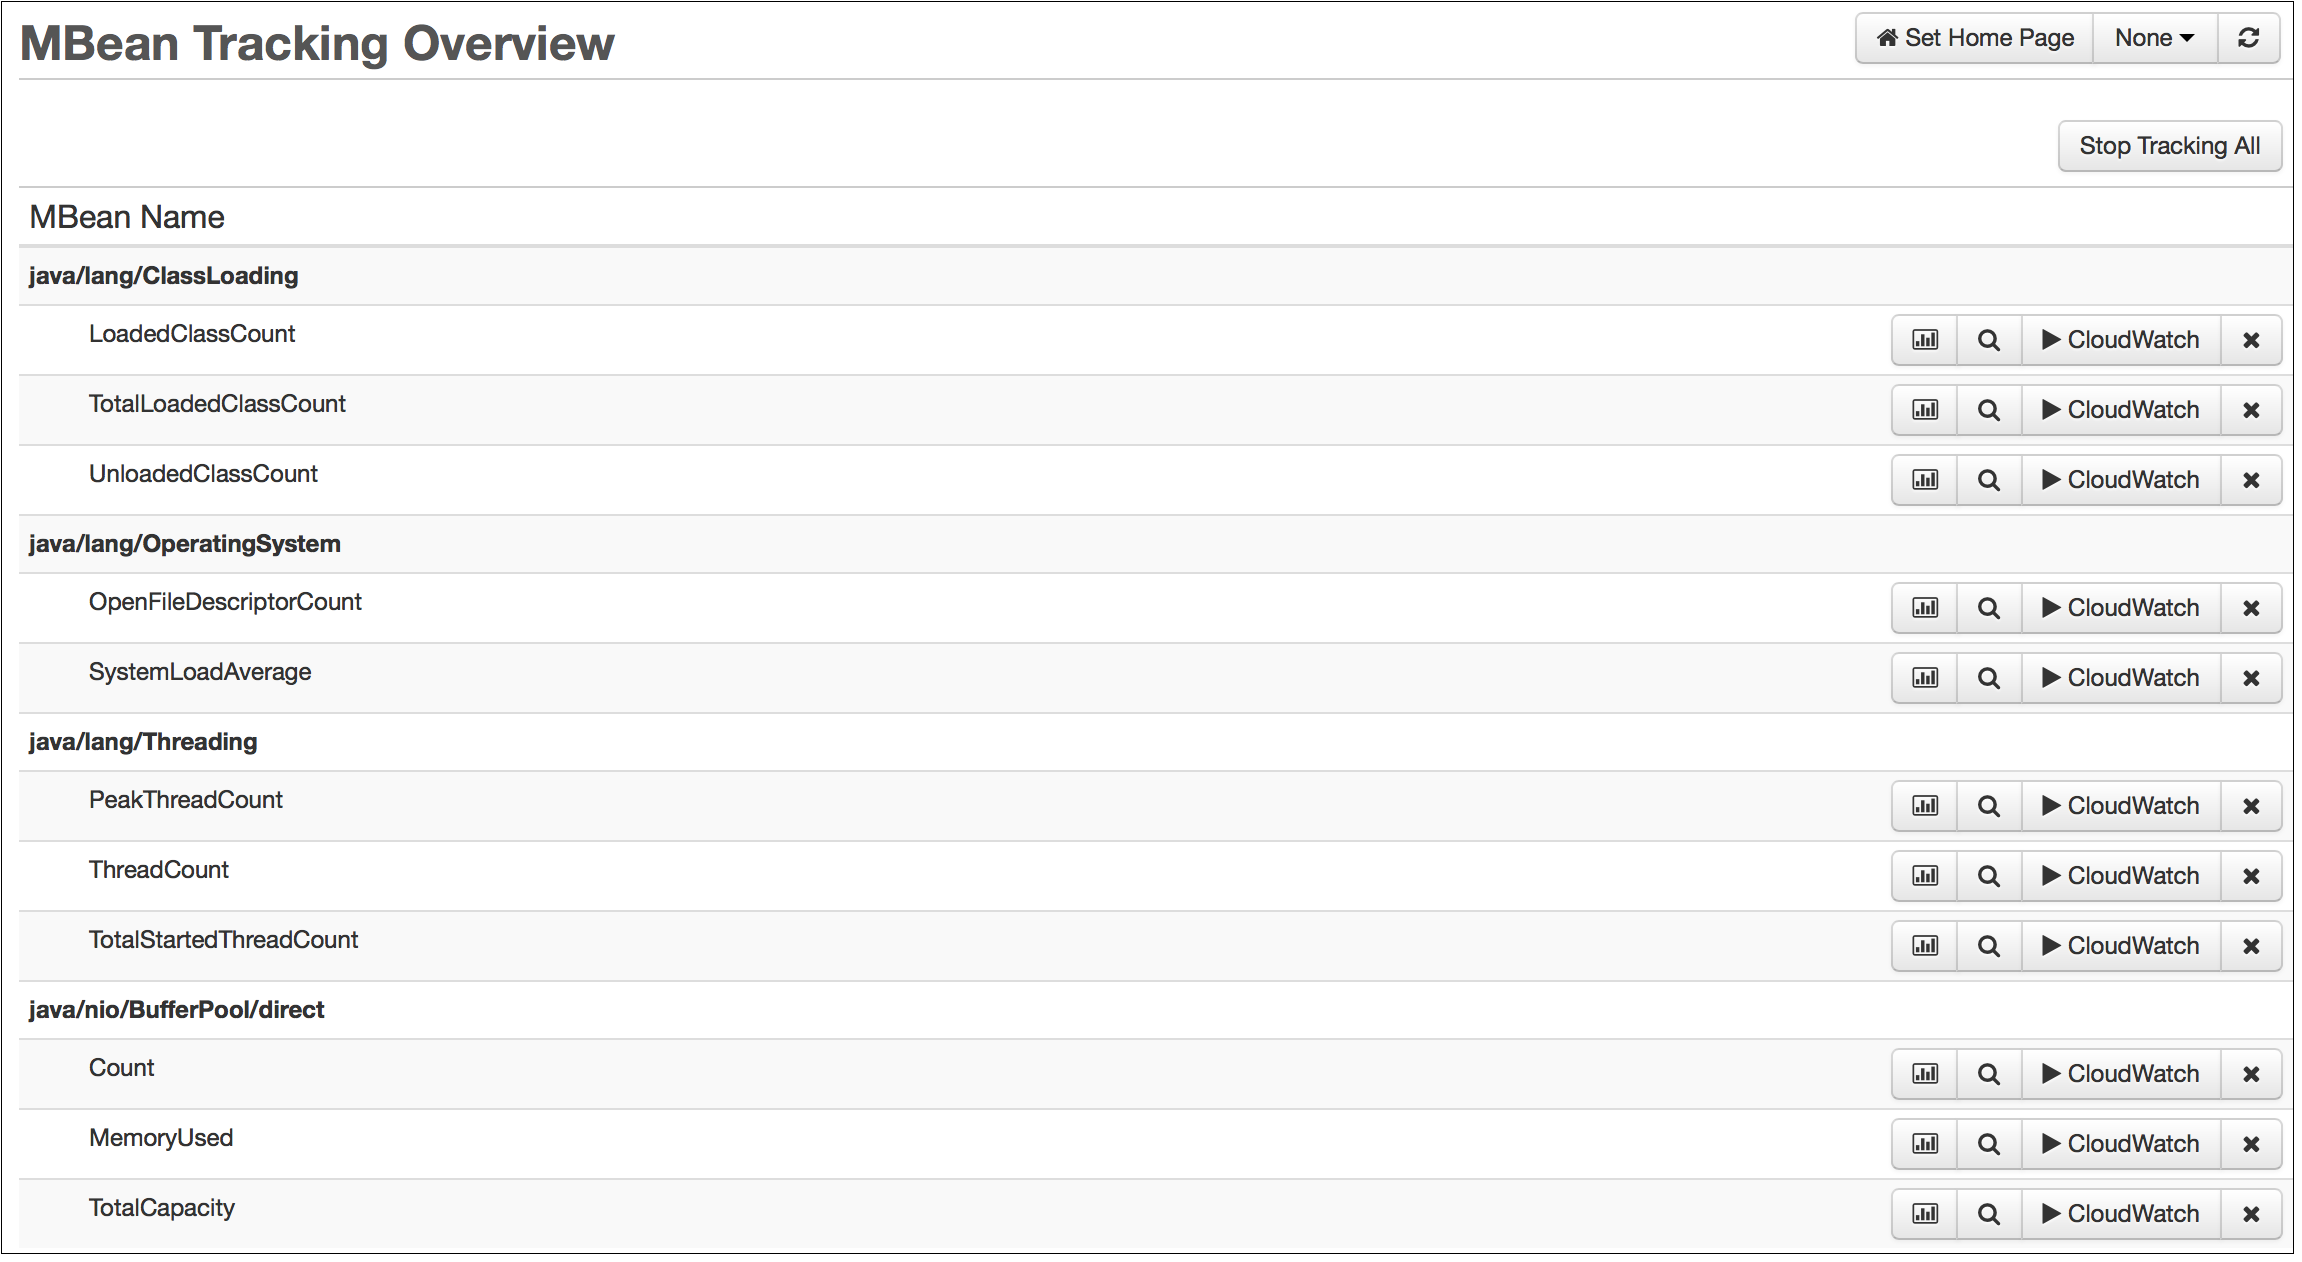
Attributes are listed by their owning bean, described in its position in the tree using slash notation.
The same operation button cluster as in JMX MBean, with the addition of the looking-glass icon. When clicked, this opens the JMX MBean page with the attribute already focussed.
JMX MBean Graphs
The JMX MBean Graphs page displays the tracked data for a single MBean-tracked value.
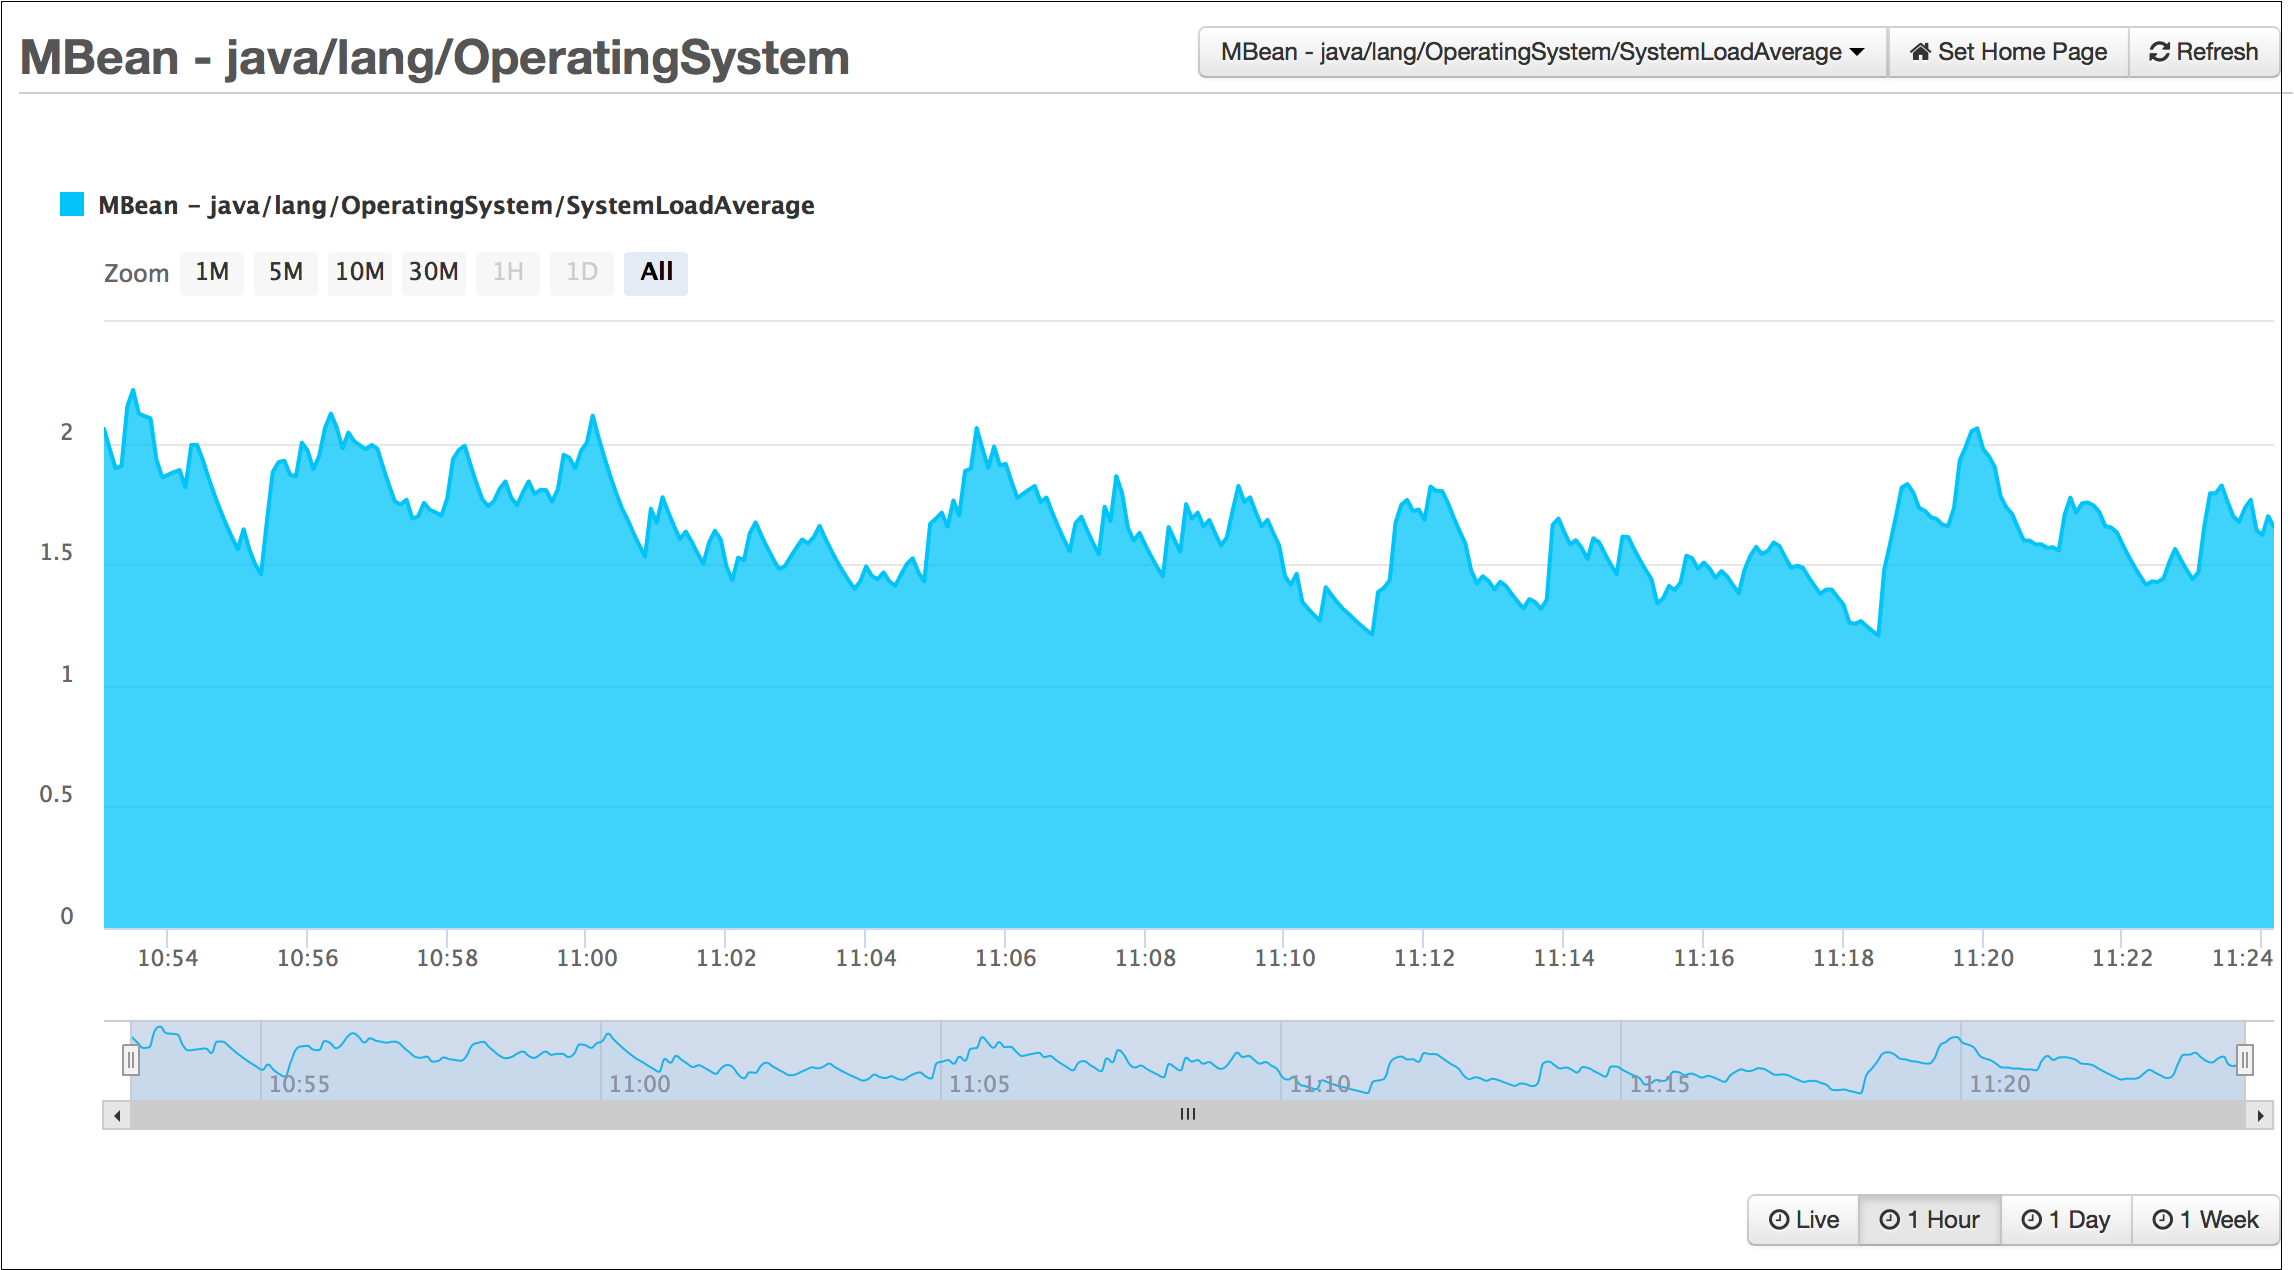
The drop-down at the top can be used to select which attribute should be displayed.

The range selector presents Live, last hour, last day or last week values, while the zoom selector zooms the graph into the selected range.
Using the two selectors together makes it possible to get both a high-level overview together with low-level fine-grained data in a single graph.
Need more help?
Contact support in the chat bubble and let us know how we can assist.