JIT Time
The JIT Time page will show you a graph of the JIT time samples currently stored in memory by FusionReactor.
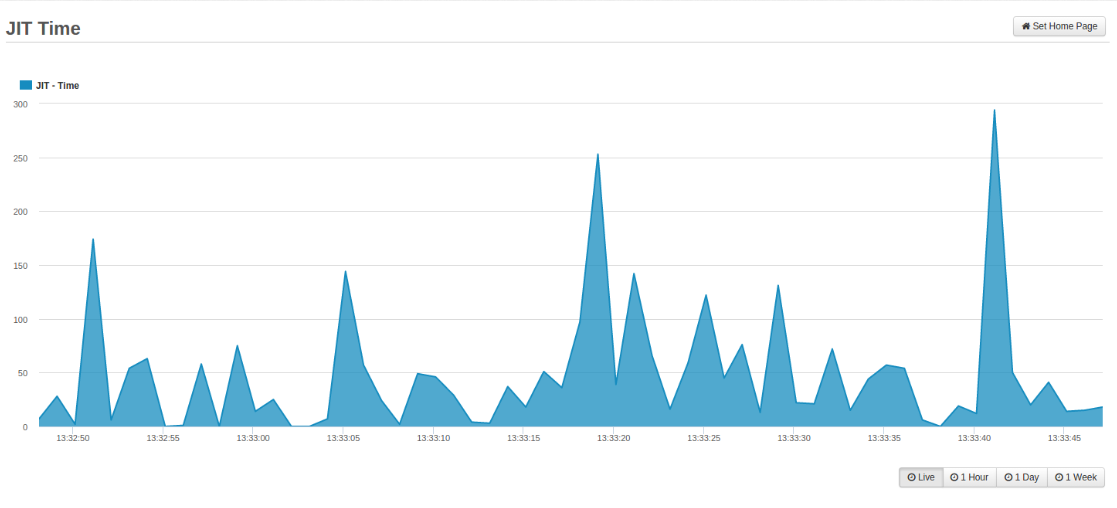
Activity Graph
Several time spans are available, with differing resolutions. These will be filled as data points that are collected by FusionReactor.
Each time varying graphs shows two independent values overlaid :
JIT - Time: Blue
- JIT (Just-In-Time) Compilation time represents the time spent by the JIT compiler converting Java bytecode into native code
To deselect and reselect each independent value, simply click on their respective names. When a value is deselected (greyed out) then that value will no longer be displayed on the activity graph.
Placing your mouse pointer on a data point within the graph shows a tool-tip with details about that sample, including:
- Date and time of the request
- JIT - Time
When browsing the 1 Hour, 1 Day, and 1 Week activity graphs you can select time frames by using the slider under the graph.
Need more help?
Contact support in the chat bubble and let us know how we can assist.