Memory Spaces
Memory Spaces
The Memory Spaces page shows you a graph of samples currently stored in memory by FusionReactor, for each of the memory spaces in your JVM.
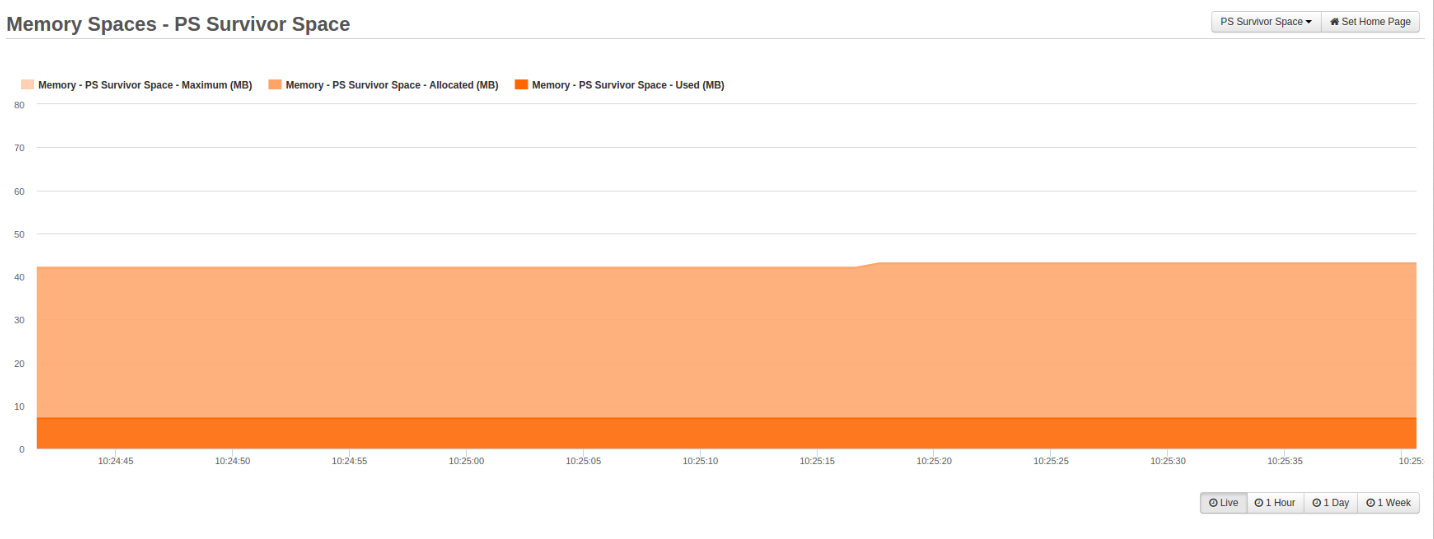
Below is a sample image of the Memory Space Graph, currently set to PS Survivor Space.
The available memory spaces can differ depending of the JVM being monitored. FusionReactor will create a graph and log for each memory space that is available. See 'Changing Space'
Several time spans are available, with differing resolutions. These will be filled as data points that are collected by FusionReactor.
Each time varying graphs shows three independent values overlaid:
Memory - [SPACE NAME] - Maximum (MB)
- This is the maximum memory available for this space.
Memory - [SPACE NAME] - Allocated (MB)
- This is the currently allocated memory for this space.
Memory - [SPACE NAME] - Used (MB)
- This is the currently used memory in this space.
To deselect and reselect each independent value, simply click on their respective names. When a value is deselected (greyed out) then that value is no longer displayed on the activity graph.
Placing your mouse pointer on a data point within the graph shows a tool-tip with details about that sample.
When browsing the 1 Hour, 1 Day, and 1 Week activity graphs you are able to select time frames by using the slider under the graph. To pinpoint specific days, times and spikes in your heap memory.
Tip
You can change the memory space using the drop down selector in the top right of the page.
Need more help?
Contact support in the chat bubble and let us know how we can assist.