FusionReactor Lucee and Railo Line Performance Plugin
The FusionReactor Lucee and Railo Line Performance Plugin are able to profile the execution of ColdFusion CFML code at line level. This data can be used to identify performance issues deep inside your ColdFusion pages and components and can be an invaluable tool for finding problems within your applications. This feature also gathers information about the CFML code coverage which can be very valuable when testing applications.
Performance Impact
Please note that this feature uses line number information generated by the Lucee or Railo application server that is known to be inaccurate in some cases and beyond our control. For this reason we cannot guarantee 100% accuracy of the information. Also note that the performance of the Lucee or Railo application server may be impacted while tracking line performance profile data. You should use FusionReactor version 6.2.0 or higher.
Please see below for important considerations about using this feature on productions systems.
Getting Started
You must have FusionReactor 6.2.0 or above currently installed on your Lucee or Railo application server
-
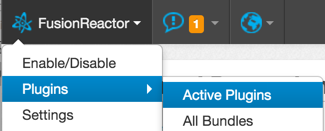
Go to: FusionReactor > Plugins > Active Plugins
-
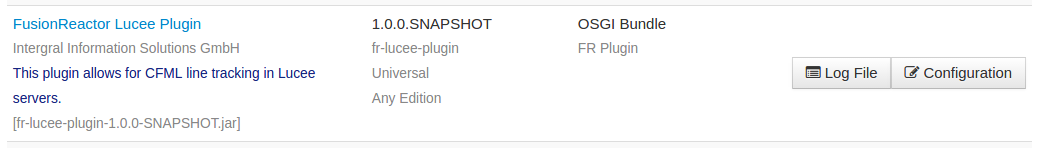
On the Active Plugins page depending upon your application server search for the relative line performance plugin.
-
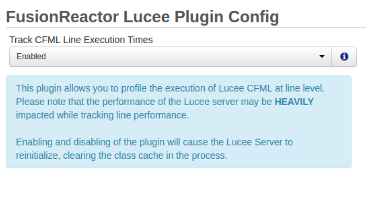
On the Configuration page - Enable Track CFML Line Execution Times
-
Save the updated configuration.
This will have immediate effect.
When you enable CFML Line Performance Tracking the currently compiled templates have to be recompiled with instrumentation in them for collecting line metric information. This results in the Lucee or Railo CFMLEngine being reinitialized and the class cache emptied until the templates have been recompiled. Recompilation can be an expensive task and could result in an application stalling. Also note the compilation will take longer than normal with CFML Line Performance Tracking because the code must be instrumented heavily with metric gathering data.
-
Depending upon your size of your applications and how many your Lucee or Railo application server is currently running you may notice a performance hit. This should quickly return to normal once the class have been recompiled.
We recommend that the Lucee line profiler should not always be enabled. As each line of code will be tracked heavily impacting your server performance. However, please be aware that disabling the plugin will cause a reinitialize of the CFML Engine, causing the class cache to be cleared and requiring all the other to be recompiled.
-
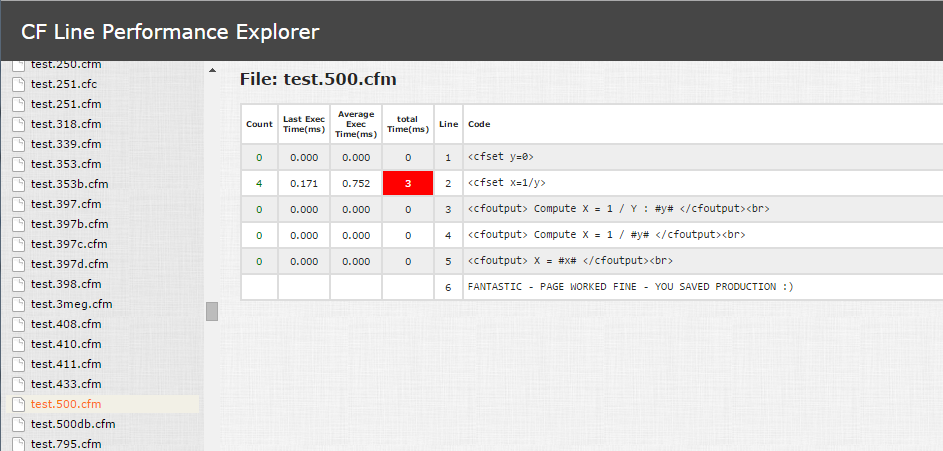
We have written a simple tool in CFML that allows you to examine the performance of your ColdFusion application code on a line by line basis. The tool requires that you have FusionReactor installed and have enabled Track CFML Line Execution Times in the Lucee or Railo Plugin.
- You will need to install this application into your Lucee or Railo webapps/ROOT and access it via the following browser address;
This tool can be found https://github.com/intergral/cfperformanceexplorer in our GitHub repository.
-
If you don't wish to use the tool - then you can also get access to the data via the FusionReactor API (FRAPI).
With tracking enabled, FusionReactor captures the information about each line of CFML code executed and stores the data internally. Using the FusionReactor API you can gain access to this information and use it generate reports about the performance of your code:
The following code will output the performance information for all of the files that have been profiled:
<h1>CFM Line Performance Tracking Tool</h1>
<cfset fragentClass = createObject("java", "com.intergral.fusionreactor.agent.Agent")>
<cfset sourceFiles = fragentClass.getAgentInstrumentation().get("cflpi").getSourceFiles()>
<cfloop from=1 to=#arraylen(sourceFiles)# index="i">
   <cfset sourceLineMetrics = fragentClass.getAgentInstrumentation().get("cflpi").getSourceLineMetrics(sourceFiles[i])>
   <cfoutput>
       <h2>
           Source: #sourceFiles[i]#: Code Coverage: #sourceLineMetrics.getCodeCoverage()*100#%
       </h2>
   </cfoutput>
   <cfoutput>
       <h4>
           Lines covered: #sourceLineMetrics.getCodeCoverageLineCount()# of #sourceLineMetrics.getTotalLineCount()#
      </h4>
   </cfoutput>

   <cfset lineMetricMap = fragentClass.getAgentInstrumentation().get("cflpi").getLineMetrics(sourceFiles[i])>
   <cfset sortedKeys = createObject("java", "java.util.TreeSet").init(lineMetricMap.keySet()).iterator()>
   <cfloop condition="sortedKeys.hasNext()">
      <cfset entry = sortedKeys.next()>
      <cfset lineMetric = lineMetricMap.get(entry)>
      <cfset lineNumber = lineMetric.getLineNumber()>
      <cfset count = lineMetric.getCount()>
      <cfset nanoTime = lineMetric.getNanoTime()>
      <cfoutput>
          <ul style="margin: 0">
          #sourceFiles[i]# #lineNumber#: Count: #count#, Time: #nanoTime#, Average: #nanoTime / (count eq 0 ? 1 : count)#
          </ul>
      </cfoutput>
   </cfloop>
</cfloop>
Considerations for Production Systems
The following points must be considered when enabling and disabling this feature on production systems:
- Enabling or disabling CFML Line Performance Tracking will result in the Lucee or Railo CFML Engine being reinitialized and the class cache being emptied, requiring a complete recompilation of your application code which may be very time consuming and will impact the performance of your application abruptly and immediately
- Under production load, the Lucee or Railo application server may not be able to recompile the code fast enough to keep up with user load, resulting in requests waiting and your application could stall completely.
- CFML Line Performance tracking can be an expensive action as every single execution of every line of code by every request/thread is tracked. Under production load, when you have a lot of requests/threads running (potentially the same code) the performance of the application may be too heavily impacted for this feature to be enabled. The granularity of the data capture that this feature requires may mean that your server does not have enough CPU capacity left to meet both the production application's load and the line performance tracking requirement at the same time.
- The overall performance of the application can be heavily impacted. The performance impact of this feature ranges typically between 2-10% but can be much higher depending on the code being executed.
- Configuring fewer simultaneous requests in Lucee or Railo may mitigate these affects in some cases.