Debugger Overview
FusionReactor Production Debugger is a new set of functionality available in the FusionReactor Ultimate Edition from version 6.0. and FusionReactor Developer Edition as well as the TRIAL edition
The Production Debugger provides the ideal solution for developers to gain insight into how code executes at production runtime and includes the following feature set:
- Rich IDE style debugger, which is completely built into FusionReactor and which allows breakpoints to be set, variables to be modified (during runtime), code de-compilation, stack traversing - as well as the usual step into, out of debugging features
- Breakpoint Email Alerting. Which consists of an email being generated whenever a breakpoint fires. The email will contain the complete stacktrace information (at the time the breakpoint was triggered) plus all of the variable context information - which gives invaluable insight into understanding what's going on.
The Production Debugger delivers a Production Safe mechanism to set breakpoints and interact with your production runtime environment in order to get instant insight into production issues.
The Debug functionality is available from the navigation bar on the left side of FusionReactor.
Any paused threads are highlighted in the navigation bar at the top of the page with the following icon:

The ability to create breakpoints in the debugger is available from the debugger page (while viewing a paused thread's details or via the 'New Breakpoint button'), any stack trace, and the error details of any Transaction.

Features
- Source code and line number specific breakpoints.
- Java Method Entry breakpoints.
- CF Function Entry breakpoints.
- Field access and modification breakpoints.
- Exception being thrown and exception caught breakpoints.
- Email alerts.
- Breakpoint samplers.
- Conditional breakpoints.
- Rate limiting.
- Interactive debugger
- View source code when configured in the sources panel.
- View decompiled code for classes without source.
- Change variables at runtime.
- Step into, out and over source code.
Interactive debugger
The FusionReactor Production Debugger also provides the ability to pause threads in an interactive debugger. This interactive debugger view is accessible from the "Debugger" page, by clicking the debug icon on a paused thread. This view is also available by selecting the debug icon from a running request or transaction with a paused thread, or from the Resources -> Threads page by selecting the debug icon on a paused thread.
The initial view of the Debugger page allows you to view source and class files, configured breakpoints, and paused threads.
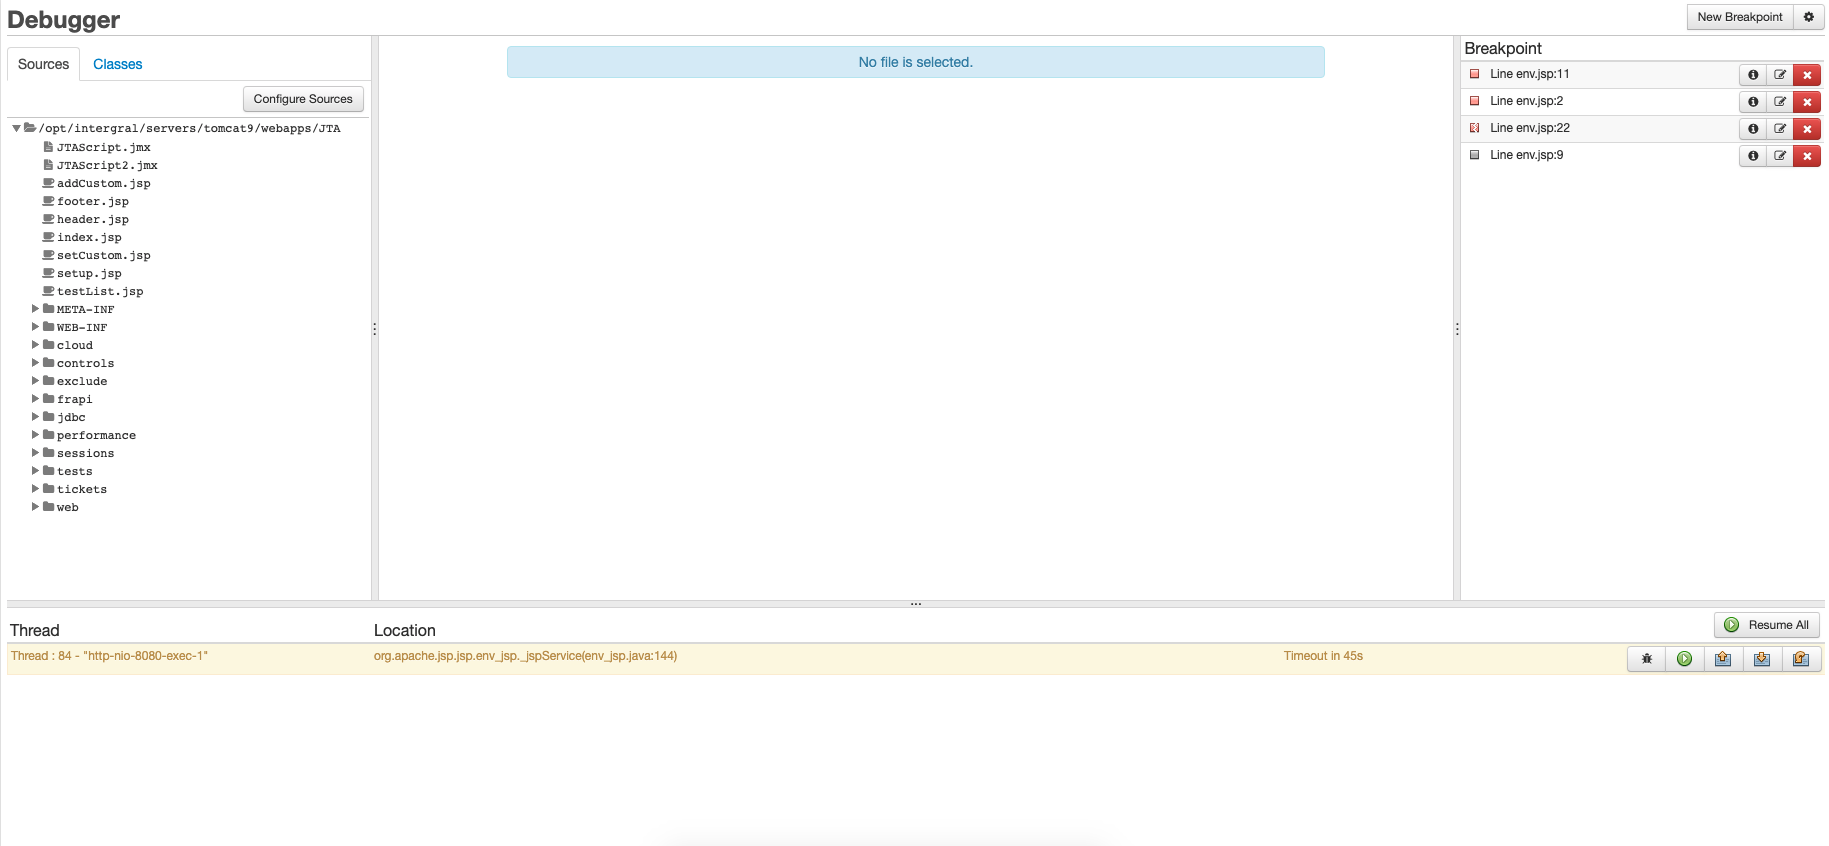
This page is split into 4 sections:
- Source Files and Class Files Viewer (top left)
- Source Code and Decompiled Class Viewer (top middle)
- Breakpoint Viewer (the top right)
- Paused Threads Overview (bottom)
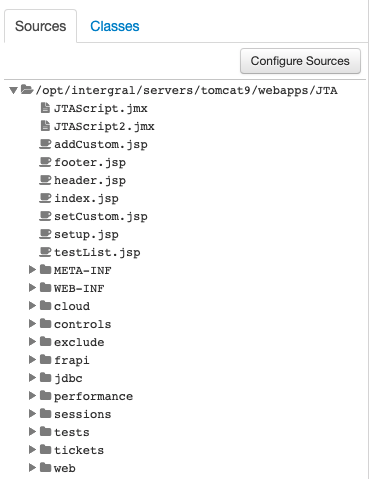
Sources / Classes
The source files tree viewer can be used to select files from configured source directories to view in the code viewer. The class files viewer can be used to selected a class loaded into the JVM to decompile and view in the code viewer. You can switch between sources and classes by using the tab selection at the top of the section. More information about sources can be found on the Sources page.
Source Code
When a file is selected from either the source file viewer or the class file viewer, it will be rendered here.
Note
Certain file types have
been excluded from rendering when clicked. If you wish to enable a
certain file type that isn't already included, you can set the system
property -Dfr.jvmti.debugger.enabled.files=.comma,.separated,.list to
enable file types for rendering in the source code viewer.
With FusionReactor 7, it is now possible to click in the margin of the decompile UI and the margin of the paused thread page source code viewer. Clicking on the margin where there is no break point will creates a new one. The Fire Count and Pause Time for this interactive breakpoint can be configured in Debug → Settings→ One Click Breakpoint settings, or by clicking the gear icon in Debug → Debugger. Clicking on an existing breakpoint will delete it. Shift clicking an existing breakpoint will simply disable that breakpoint.
Breakpoint
The breakpoint section shows currently configured breakpoints.

The information button (the i button) can be used to view details about the breakpoint. Edit (to the right of information) can be used to edit the configuration of the breakpoint. The red cross (rightmost button) can be used to remove the breakpoint permanently. For more information, see the Breakpoints page.
Paused Threads
The paused threads section at the bottom of the page shows all the threads which are currently paused in the debugger.

This table shows which threads are paused threads and at what location.
The table has information showing the Thread, Location (i.e. the class, method and line number of the paused thread) and the timeout before this thread will continue to execute as normal or until it hits another interactive breakpoint. The timeout will not be shown unless the user has configured a timeout for the breakpoint.
The table has a row for each thread with a set of buttons, allowing the user to view details of that specific thread or control how the thread should execute next.

The buttons shown per thread paused are the following, from left to right :
The Debug button will take the user into the thread-specific view. See Thread View.
The top toolbar contains a resume all button which is ideal for continuing many threads. E.g. if you have just removed a breakpoint and would like all the threads to resume.
Viewing a paused thread
The Thread View shows the details of a specific thread once the thread has been paused in the interactive debugger.
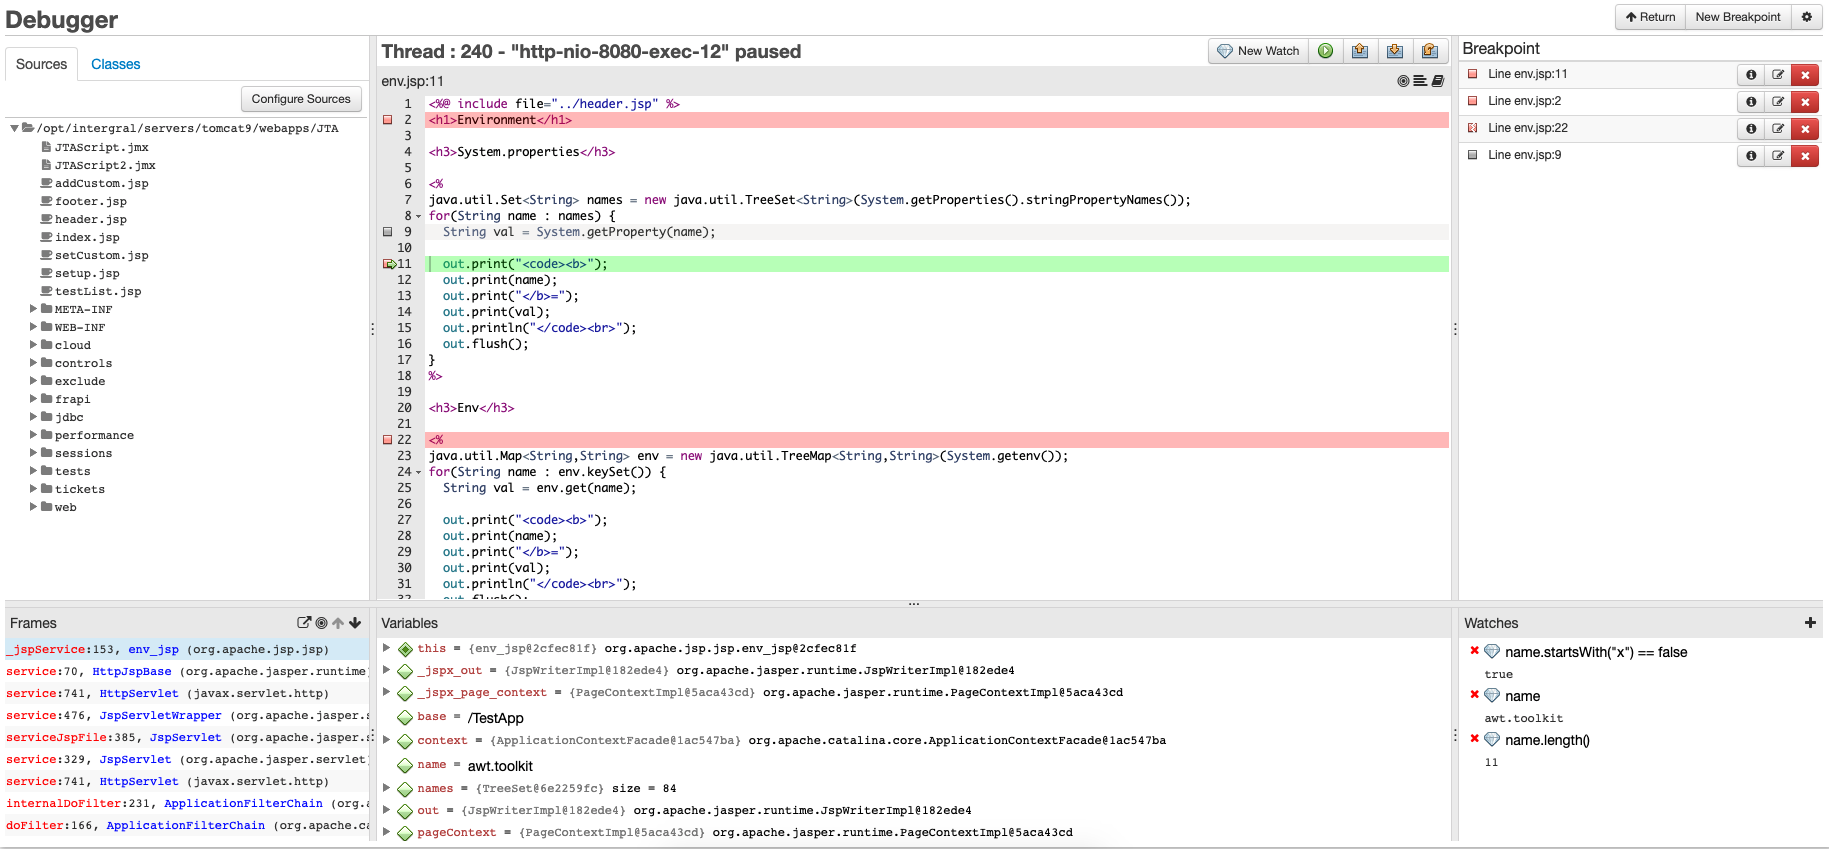
This bottom part of the UI changes to show
- Stack Trace / Stack Frames (bottom left)
- Variable Viewer (bottom middle)
- Watches (bottom right)
In the top right of the debug source code viewer are 3 buttons (from left to right)

- The first scrolls the editor to the line number where the thread is paused.
- The next button view the stack trace for this thread.
- The next button shows the transaction details for the paused thread (if it exists). This button may not always exist.
Source Code Viewer for a Paused Thread
The source code viewer shows the source code for the location where the interactive debugger is currently paused.
This viewer uses the configured Sources to find and load the correct file into the user interface. If no source file is found in the Sources, the decompiled code will be shown. The decompiled code will only show line numbers for lines which are known to have source lines. This means it is not uncommon for the left margin to have missing line numbers. These line numbers are normally not present in the class file, e.g. for comments.
The viewer supports syntax highlight for Java, JSP, and CFML files.
The viewer will highlight the lines where breakpoints are currently configured in red and a red square in the margin:

The line where the current thread is paused will be shows with a green arrow in the margin and a green highlighted line:

When both occur at the same time - I.e. the thread is paused on the breakpoint location - you will get a green highlighted line but will see a mix of the green arrow and red box in the margin:

Disabled breakpoints in the source code appear as grey square.

When the breakpoint is disabled and the thread is paused on the line you see a green arrows with a grey square.

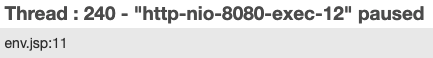
At the top of the viewer is the thread information. The thread information shows the request running on this thread and other information regarding the thread. This information matches the thread information shows in Stack Trace pages of the Resource -> Threads.
Stack Trace / Stack Frames
The stack trace view in the debugger shows the stack frames of the currently-paused thread.
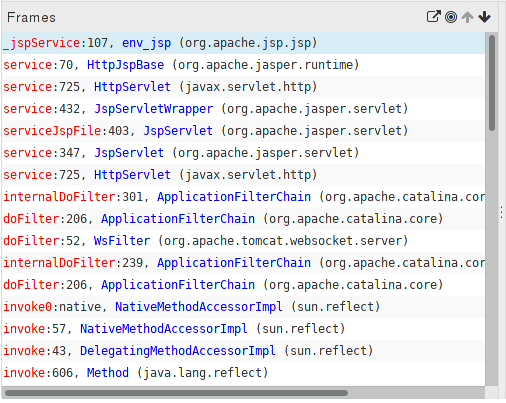
Clicking on any of the frames allows the user to select which stack frame they would like to view. When changing the stack frame, simply click on one of the grey arrows and the Thread View page loads the source and variables for that stack frame. The green arrow for the stack frame shows which stack frame you are currently viewing.
The icons on the top right of the 'Frames' section of the UI are the following (left to right):
- Decompile the currently-selected frame

- Scroll the UI to show the currently-shown frame

- The up button is to go up a frame (from the current)

- The down buttons goes down a frame (towards where the thread started)

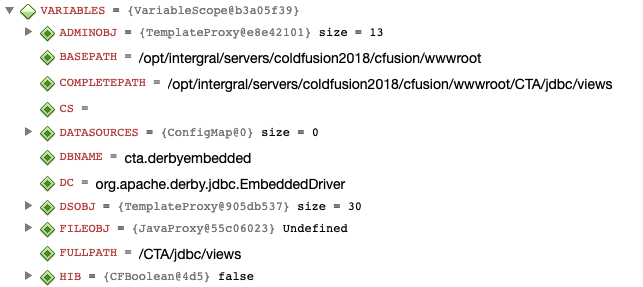
Variable Viewer
The variable viewer shows the variables currently available on the thread at the specific location that the interactive debugger has paused.
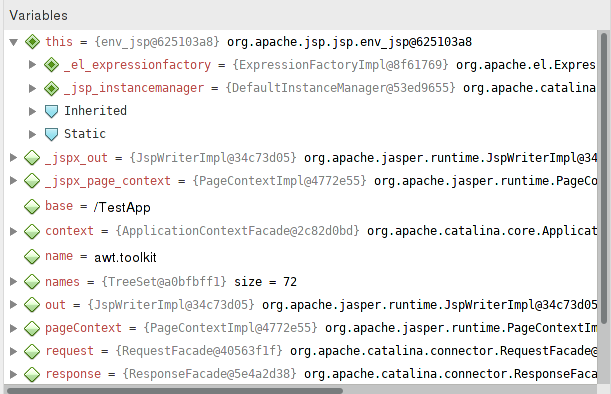
The variables are shown as a tree, the top-most nodes in the tree show
the variables which are local variables in the function. For all
non-static method calls there should be a 'this' object which the
method is being called on (unless it has been optimized away).
The red text shows the variable name, the class name and
Object.hashCode() is shown in light gray and on the far right (in
black) is the toString() value of the variable. The full class name is
available via a tooltip on mouse-over of the variable.
Variables can be expanded for objects to see their fields, static variables and inherited variables.
Any field or variable which is a primitive type (e.g. int, boolean )
or ajava.lang.String can be modified in the right side of the
variables tree. Simply move your mouse over the value you want to
change, it will change to an input area when your mouse is over the
value and the value can be modified. Simply modify the value and press
return.
Watches
Watches can be set in the Debugger → Thread view once a breakpoint has paused a thread (the bottom right of the FR page). Valid watches are Java or CFML expressions. The interactive debugger will attempt to evaluate the watches with variables / CF scopes information at runtime.
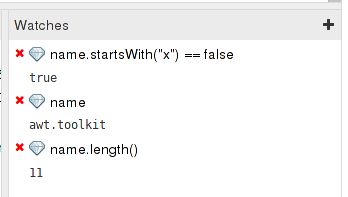
You can click the + to add a new watch or press the red x to delete the watch. You can also modify the watch by clicking the expression being evaluated. Watches are not deleted when the thread is resumed - they will be evaluated the next time a breakpoint is hit.
Stepping
The interactive debugger allows the user to control the flow of the thread, allowing them to view the variables, source and stack as the thread progresses through the code.
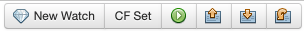
This is done via the controls at the top of the code viewer when viewing a paused thread.
Note
CF Set will only appear for CFC/CFM files (see CFML Set Variable).
Resume
When clicking the resume button, the thread will resume from its current location and continue to run until the next interactive breakpoint is hit.
When pressed in the thread view, it shows a message box saying that the thread is now running or terminated. If the thread hits another breakpoint in under 1 second, the thread view will be shown for the thread again.
Step Out
When clicking the step out button the thread will continue to execute until the method that the thread is currently in returns. The thread will then pause in the interactive debugger. If this takes more than 1 second or the thread is terminated then a message will appear informing the user.
Step In
When clicking the step in button the thread will continue to execute until the next line number is hit in the current method or the thread steps into a new method. The thread will then pause in the interactive debugger. If this takes more than 1 second or the thread is terminated then a message will appear informing the user.
Step Over
When clicking the step over button the thread will execute until the next line number is hit in the current method or the current method returns. The thread will then pause in the interactive debugger, if this takes more than one second or the thread is terminated then a message will appear informing the user.
CFML Scopes
When the thread is paused inside a CFML-specific file (CFC / CFM) the variables view shows CFML scopes in the Variables View. These function the same as the local variables in the Variables View, but come from the scope locations which are available at the location that the thread is paused.
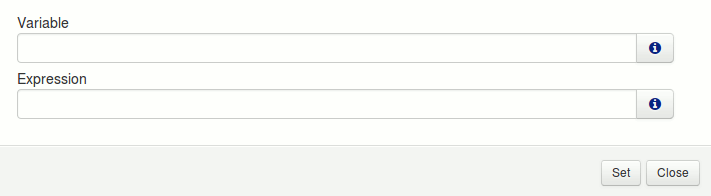
CFML Set Variable
When the thread is paused inside a CFML-specific file (CFC / CFM), the top toolbar will show a new button labelled "CF Set". This button allows the user to set a variable in the CFML scopes by simply typing in a variable name and a variable value.
Simply type the variable name into the Variable field and type the expression into the Expression field and then press the "Set" button.
E.g.
Variable
1 | |
Expression
1 | |
Sampler Graphs
The sampler graphs page of the debugger allows the user to see how often a breakpoint is being hit.
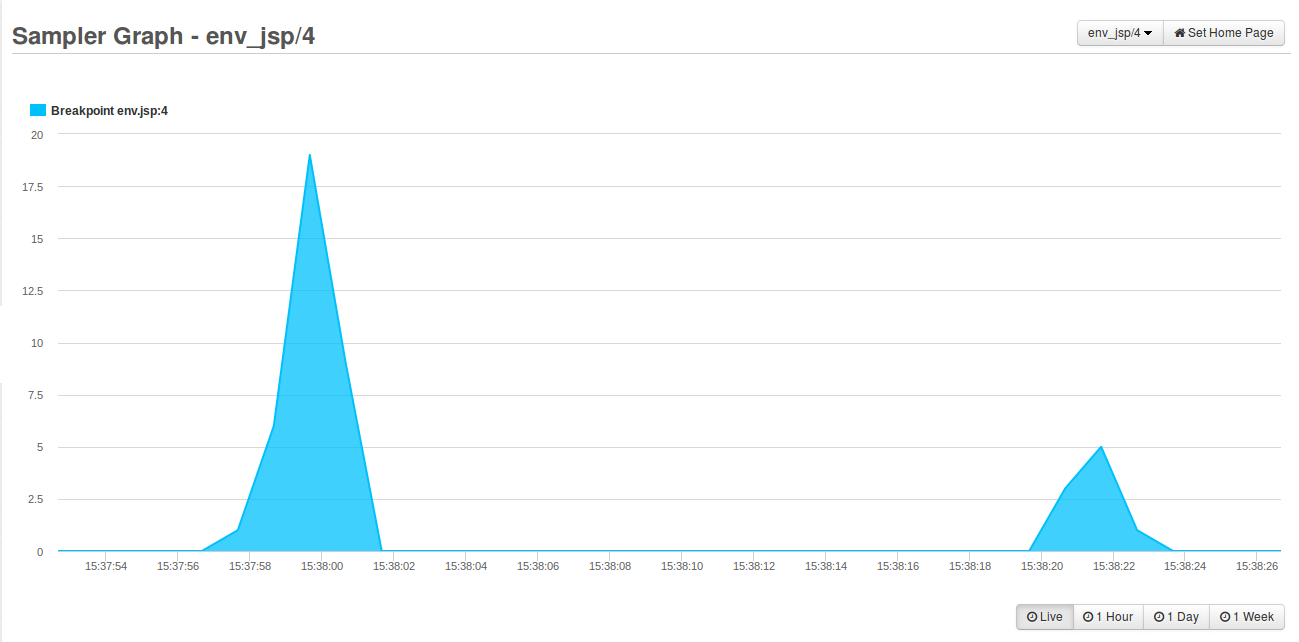
In the top right of the page the user can select which specific breakpoint sampler series to view.
Examples
The Production Debugger in FusionReactor is very powerful and can be daunting when you first start to use it.
We have prepared some examples, which include the code, breakpoints and results, to aid your introduction to the debugger.
- Debug Example : Setting a conditional breakpoint in ColdFusion loop
- Debug Example : Setting an automatic breakpoint following a ColdFusion Exception throw
- Debug Example : Setting an email alert on first occurrence of an exception
- Debug Example : Setting conditional breakpoint in catch block
- Debug Example : Filter on a specific IP Address in JSP/Servlet requests
Manual Installation
The debugger relies on a native library. If FusionReactor is not installed by FRAM, the Manual Debug Installation instructions must be followed to enable the Production Debugger.
Known Issues and Limitations
Info
The Production Debugger is only available on 64 bit operating systems
Database Table Lock Escalation
With some databases (especially Microsoft SQL Server) it's possible for a single thread to lock a database table completely until the transaction is committed.
If you set the maximum paused threads in the debugger to be 1, it's still possible that this 1 paused thread can stop all others from functioning.
This will occur if you do the following:
- Start a transaction.
- Perform some SQL which escalates to a full table lock in the DB.
- Set a breakpoint in code which is before the commit occurs.
Step 2 locks the database table, but it's never committed. The debugger then pauses this thread in the debugger and as a result, the duration of the table lock will be a lot longer and that causes all other threads which need to acquire this table to lock to pause too.
Double submits and replay attacks
When using the Production Debugger it is good to ensure that the website being debugged can cope with multiple submits from the same form.
If you have the following case:
- User A submits a form to the website.
- The Debugger pauses the thread in the interactive debugger with a 5 minute timeout.
- User A sits there waiting and gives up. They press submit again.
- This request goes through (maybe due to Fire Count or Max Thread setting not allowing it to be paused).
- After 5 minutes the initial submit from step 1 goes through.
- Unless the DB or the server logic can cope with this the customer may end up purchasing 2 of the items.
GLIBC 2.14
For debugger to work it uses a native library to provide some of the debug features.
This native library relies on GLIBC version 2.14 library.
Tech note : FRS-355
provides a version of this libc.so.6 and instructions on how to use it just for
the debugger.
Rate Limiting ordering
The production debugger has 3 different rate limit options.
- Breakpoint -> Fire Count - how many times a breakpoint should fire before becoming disabled.
- Settings -> Email Alert Interval - the delay between emails being sent where emails simply don't get sent.
- Settings -> Max Threads - the maximum number of threads which can be paused in the interactive debugger. If this is hit all new breakpoints simply continue and never stop in the debug engine.
Fire Count with Emails
When using the breakpoint fire count limit and the email alert interval it should be understood that the fire count is a precondition.
I.e. the code executes the breakpoint in the following steps.
- Check if the breakpoint fire count limit has been hit. If not continue to step 2 and increase the counter
- Check if the email alert interval allows emails to be sent.
- Send email or silently ignore alert due to settings in #2.
This means that the precondition of the fire count will increase even though the email alert interval vetoes the email being sent.
Fire Count with Max Threads.
When using the breakpoint fire count limit and an interactive breakpoint with the max threads settings the fire count is a precondition.
I.e. the code executes the breakpoint in the following steps.
- Check if the breakpoints fire count limit has been hit. iI not continue to step 2 and increase the counter
- Check if the max threads settings allows this thread to be paused.
- Either pause the thread in the interactive debugger or veto the pause event and continue the threads execution.
This means that the precondition of the fire count will increase even though the max thread setting vetoes the thread being paused.
Performance Impact
Exception Support
When enabling the exception breakpoint capability, it causes the JVM to activate a special mode. Although generally, no performance impact will be felt with this mode, it can cause some operations to become slow. Also, this setting is known to heavily affect the compilation time of large files on ColdFusion and operations which throw a lot of exceptions (like javacc-based parsers).
If you enable this, it is recommend that you also enable the "Save Classes" feature on ColdFusion servers to avoid recompilation. The "Save Classes" feature can be found in the ColdFusion admin console under the Server Settings > Caching.
Exception Support can be enabled by configuring the following system property in the JVM arguments file:
-Dfr.jvmti.enable.exceptions=true
Info
Event Snapshots can be triggered when exceptions occur. The event snapshot generation cannot be triggered from exceptions / errors unless the exception support is enabled.
Stepping Mode
By default, the Production Debugger runs in "Low-impact stepping mode". This stepping mode ensures that the JVM runs as quick as possible but also means that stepping operations like Step-Out and Step-Over may take longer.
You can enable the "Fast stepping mode" by configuring the following system property in the JVM arguments file:
-Dfr.jvmti.enable.fast.stepping=true
When the "Fast stepping mode" is enabled, it ensures that stepping operations are executed as quickly as possible however, keep in mind that this might have a negative impact on the JVMs performance.
Although generally, no performance impact will be felt with the "Fast stepping mode" enabled, it can cause some operations to become slow.
Warning
The setting is known to heavily affect the compilation time of large files on ColdFusion and operations which throw a lot of exceptions (like javacc-based parsers). If you enable this mode, it is recommend that you also enable the "Save Classes" feature on ColdFusion servers to avoid recompilation.
Debugger Settings
Under the general setting for the debugger there is an option to disable / enable debugger.
| Configuration | Description | Default |
|---|---|---|
| Active | Enables or disables all hooks used by the Production Debugger effectively disabling all events from firing. This will remove all breakpoints from the debugger and disable most of the hooks that the debugger uses. | Enabled |
Email
This section provides settings specific to the email handlers.
| Configuration | Description | Default |
|---|---|---|
| Email Alerts | Enables or disables the email alerts for the Production Debugger | Enabled |
| Email Address | Enter one or more addresses (comma separated) to use for the Production Debugger specific emails instead of the default FusionReactor email addresses configured. | N/A |
| Email Alert Intervals | This is the period (in seconds) that must elapse before the next email alert can be set. Leave empty to receive all emails. | N/A |
Threads
This section provides settings specific to the thread handling in the debugger.
| Configuration | Description | Default |
|---|---|---|
| Max Threads | The maximum number of threads which can be paused at once in the Production Debugger. Leave empty for no limiting. 0 means no threads can be paused. Currently-paused threads will not be affected. | N/A |
Stepping
| Configuration | Description | Default |
|---|---|---|
| Max Step Duration | The maximum duration the Production Debugger will continue to step code until the next location. (duration in seconds) | 15 |
Exceptions
The exceptions settings exists to simply say whether exception support has been enabled. This feature has to be enabled by setting the java argument
-Dfr.jvmti.enable.exceptions=true
One Click Breakpoints
| Configuration | Description | Default |
|---|---|---|
| Fire Count | The default fire count which controls how many times to fire the new breakpoint before it becomes disabled. This fire count is used for all new breakpoints created by clicking in the source UI margin. | 1 |
| Pause Time | The default time to pause the thread, in seconds, before continuing. This time out is used for all new breakpoints created by clicking in the source UI margin. | 60 |
Event Snapshot
| Configuration | Description | Default |
|---|---|---|
| Enabled | Enables or disables the event snapshot generation in the Production Debugger | Disabled |
| Snapshot Directory | The directory to store the heap snapshots into. Changing this directory will not affect the old directory. It will still exist and will still contain the snapshots. All new snapshots will be created in this new directory. | |
| Event Snapshots per minute | The maximum number of event snapshots which will be generated per minute. | 10 |
| Event Snapshots per transaction | The maximum number event snapshots which can be generated per transaction. | 2 |
| Log statement snapshot level | This setting controls the minimum log level for which an Event Snapshot will be generated. Logging at this level or more severe will trigger a snapshot. Since the Log Tracker Plugin triggers these snapshots, its configuration must also be set to this (or a less severe) level. | ERROR |
| Maximum number of snapshots to retain | The maximum number of event snapshots stored on disk. Older files are removed first. Default is 1000 files. | 1000 |
| Maximum total size of snapshots to retain (in kB) | The maximum size of all event snapshots stored on disk. Older files are removed first. Default is unset. | Not Set |