Dashboard settings
Change dashboard settings
The dashboard settings page allows you to:
-
Edit general dashboard properties, including time settings.
-
Add annotation queries
-
Add dashboard variables
-
Add links
-
View the dashboard JSON model
To access the dashboard setting page use the Dashboard settings (gear icon) located at the top of the page.
The following screen is displayed:
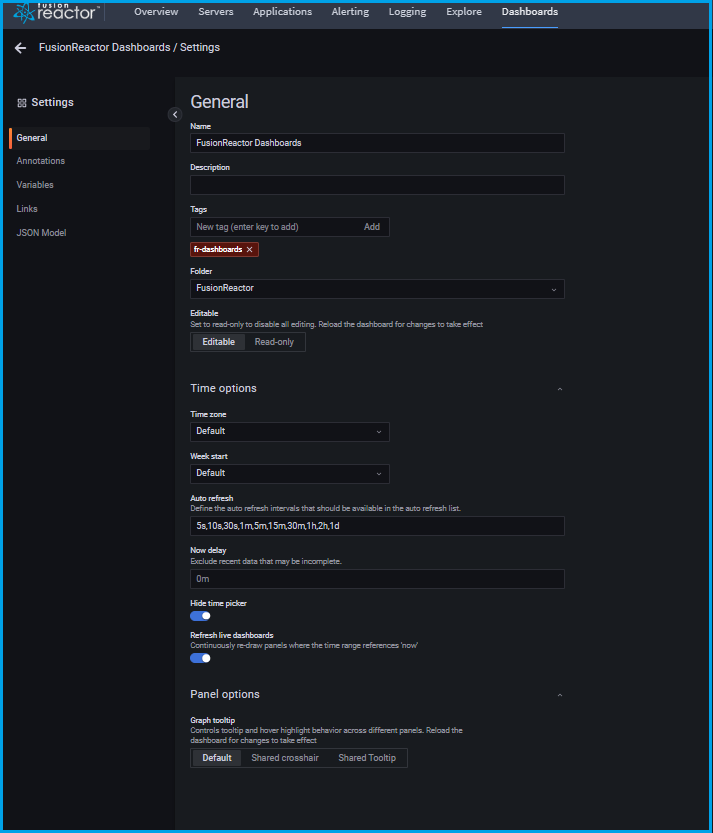
Change dashboard time settings
Find it: FusionReactor > Dashboards > Settings > General
Adjust dashboard time settings to modify the dashboard timezone, the local browser time, and specify auto-refresh time intervals.
On the Dashboard settings page, navigate to Time Options.
Specify time settings according to the following descriptions.
- Timezone: Specify the local time zone of the service or system that you are monitoring. This can be helpful when monitoring a system or service that operates across several time zones.
- Default: FusionReactor uses the default selected time zone for the user profile, team, or organization. If no time zone is specified for the user profile, a team the user is a member of, or the organization, then FusionReactor uses the local browser time.
- Local browser time: The time zone configured for the viewing user browser is used. This is usually the same time zone as set on the computer.
- Standard ISO 8601 time zones, including UTC.
- Auto-refresh: Customize the options displayed for relative time and the auto-refresh options. Entries are comma separated and accept any valid time unit. Now delay: Override the now time by entering a time delay. Use this option to accommodate known delays in data aggregation to avoid null values.
- Hide time picker: Select this option if you do not want to display the time picker.