On-Prem capabilities
Web Metrics
🔎Find it: FusionReactor > Metrics > Web Metrics
The Web Metrics screen presents the data recorded by FusionReactor related to your application server and its request load in a curated, useful and easy-to-analyse structure.
Graphs
There are six default graphs which categorize the data:
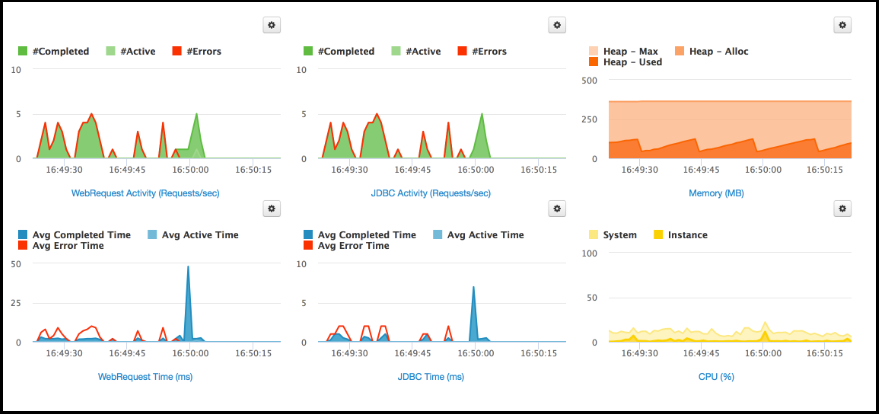
Graphs can be customised by changing the time range. Clicking on the name below the graph (for example: CPU) creates an enlarged version of the selected graph.
Tip
To see data for a specific time frame, click and drag your mouse to a start and stop time. Releasing the mouse will zoom into the selected time frame.
Tables
FusionReactor also displays a series of tables with useful information about the application server.
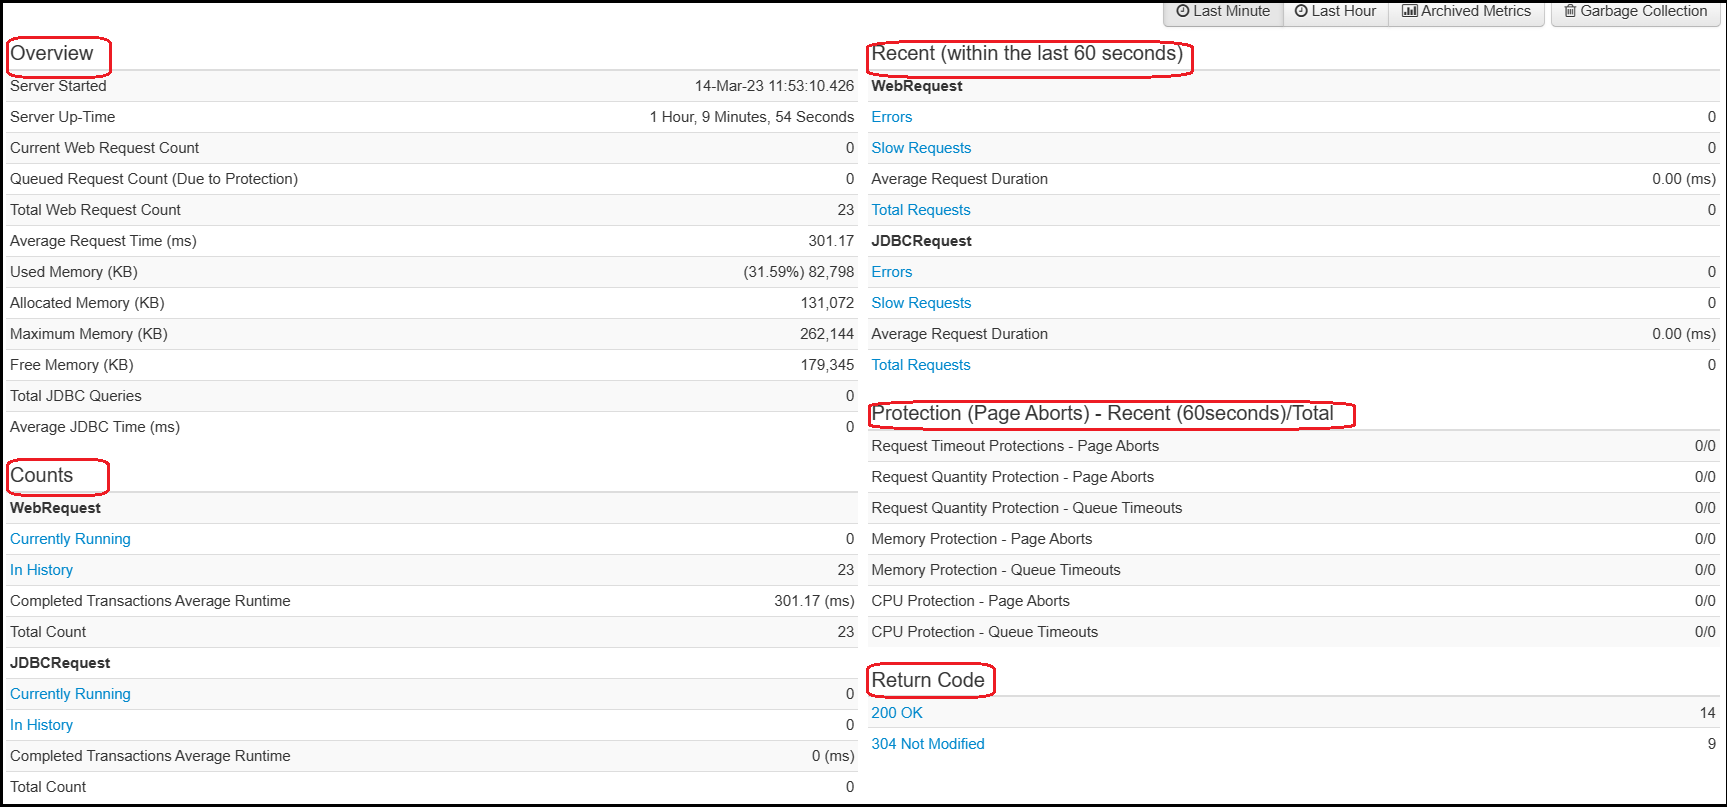
In the Overview table, you are provided with general statistics about the application server such as Server Uptime which tells you how long the server has been active for and the Average Request Time a request is taking to be processed.
The Counts table provides numbers on the state of Web Requests and JDBC Requests by your application server within the last 60 seconds.
The Recent table shows information about recent Web Requests and JDBC Requests (recent meaning any requests within the last minute).
This Protection table displays the statistics of the Crash Protection triggers, revealing the type of protection that caused the trigger.
The Return Code table lists all HTTP codes which have been returned by this application server. Each return code is also a link which will show you all requests from the current request history which have that return code.
Learn more
Performance troubleshooting
Request History
🔎Find it: FusionReactor > Requests > History
The Web Requests History page shows a list of the most-recently completed requests. The number of historical requests stored is configurable - the default is set to 100. All the request information is stored in memory - as new requests enter the list, older requests are removed.
Slow Requests
🔎Find it: FusionReactor > Requests > Slow Requests
Selecting Slow Request displays a list of all Slow Running and Slow Finished transactions, which have taken longer to run than the current slow request threshold which is set to 8 seconds.
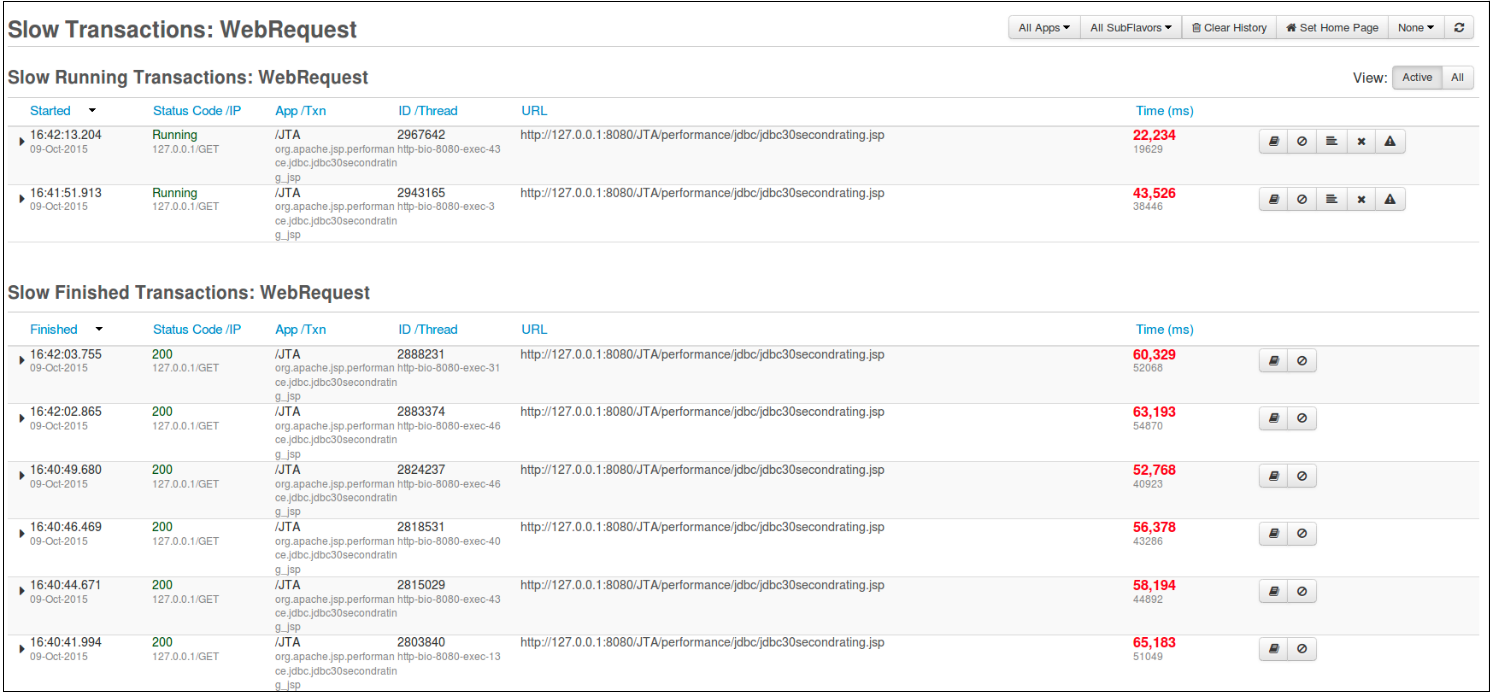
On each query you will see the Total & CPU time, the time spent in your database and the API time.

Tip
Selecting the arrow next to the timestamp of a slow transaction gives a deeper insight into your request.

Each request listed on the page has two icons next to it. They are:
| Button | Name | Description |
|---|---|---|
| :fa-book: | Details | Clicking this button will redirect you to the Details page for the selected JDBC transaction |
| :fa-ban: | Add to CP | Clicking this button will redirect you to the Protection Restrictions page which will be filled out for this request. |
Tab selection
At the top of the Request Details page you will see a copy of the request line from the page you came from. Underneath that there are at least five tabs, plus one for each context on that transaction.
Learn more
Tip
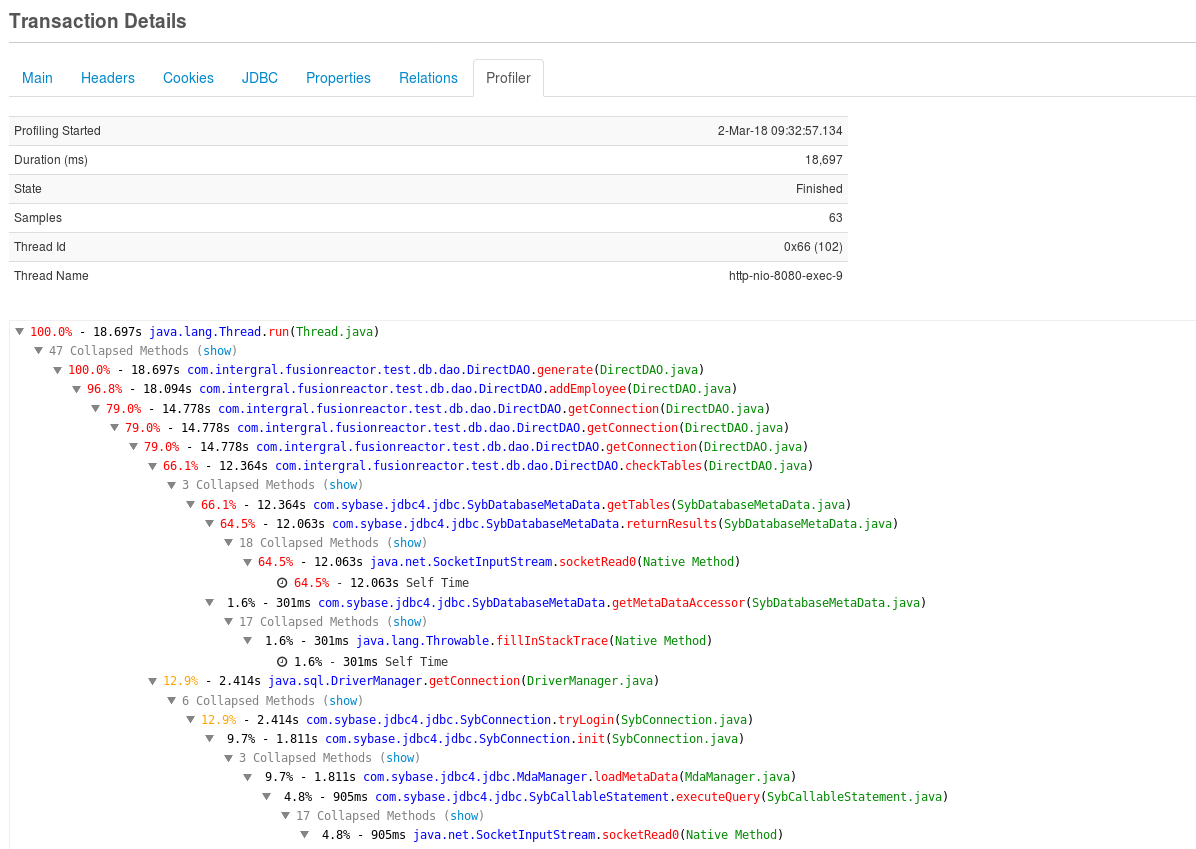
When you have a slow request, first look at the queries on the main tab to find out if it was database or API and then use Relations and JDBC for further details. If it isn't a relation, use the Profiler tab to diagnose issues.
Profiler
The profiler is designed to help you identify performance bottlenecks in your production environment with very low overhead, so you gain maximum benefit, without impacting your running applications. The profiler breaks down the time spent by the request in percentages, so it fills in the gaps of the request of where the time went that wasn't Database or API calls. So, if a request was long but DB and API time shows as short, then it's likely somewhere in the code with the issue.
Learn more
Root cause analysis
Errors
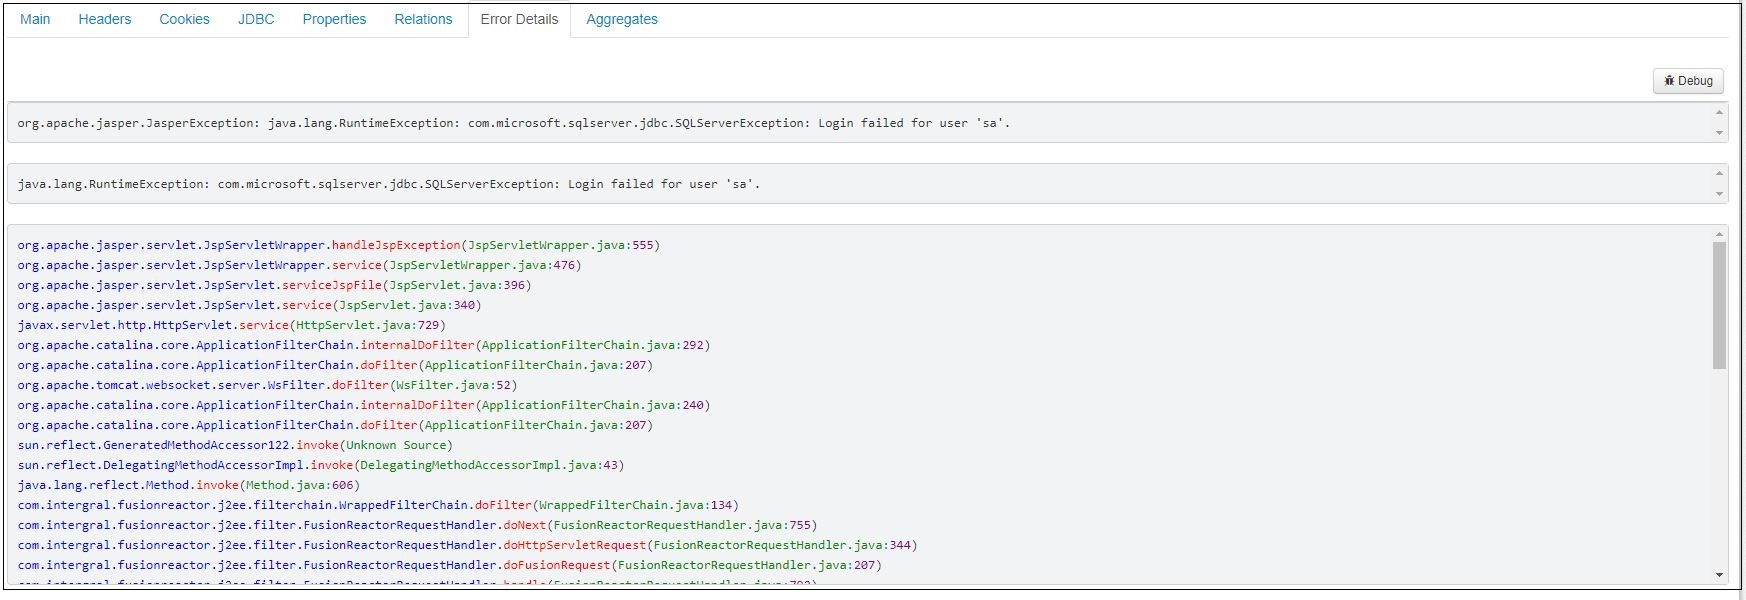
If an error is detected, then details of this will be displayed in the Error Details tab. This will include the error exception details, as well as a stack trace of where the error happened. By clicking on individual classes or methods, it is also possible to perform instant de-compilation.
Event snapshots
Event Snapshots are generated for specific events that may occur whilst FusionReactor (FR) monitors your application. They are triggered automatically and provide deep level insight whenever a problem, such as an exception or thread latency occurs.
The Event Snapshot displays source code, scope variables, stack trace and logging information at the point the problem occurs; providing everything you need to isolate the issue as quickly and efficiently as possible. They fill the gap between simple error tracking (stacktrace) and the full interactive debugger (allowing step through control within your code and the ability to modify variables).
Debugger
The production Debugger provides insight into how code executes at production runtime and includes:
- A rich IDE style debugger which is completely built into FusionReactor and allows breakpoints to be set, variables to be modified (during runtime), code de-compilation and stack traversing.
- Breakpoint email alerting which consists of an email being generated whenever a breakpoint fires.
Archive viewer
🔎Find it: FusionReactor > Metrics > Archive Metrics
FusionReactor allows you to go back in time by selecting Archive Metrics. Everything in FusionReactor is stored as a log and they are stored for 31 days.
This feature is useful if you have a crash as it allows you to go back and view all the details before and around the crash.
Tip
Use the timepicker at the top to change the day/hour.
Crash protection and alerting
Crash protection gives you the ability to alert when the application server is experiencing issues and prevent application servers from crashing.
Tip
Use the :fa-ban: icon to add a new Protection Restriction
Enterprise dashboard
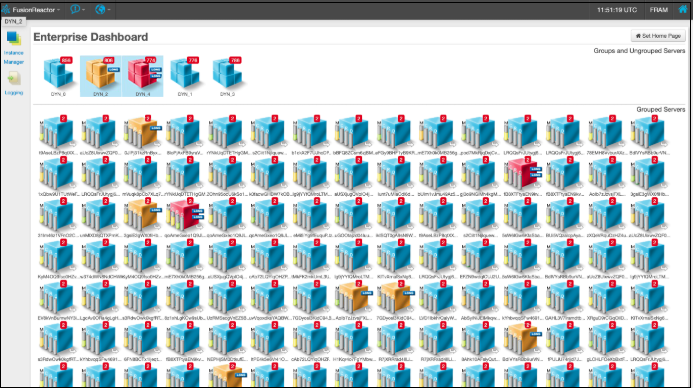
The Enterprise Dashboard is a powerful tool providing an overview of your infrastructure from one location.
From this dashboard, you can:
-
monitor the state of group and individual instances
-
set thresholds for instances to enter a warning or error state based on the resource usage.
Learn more
Need more help?
Contact support in the chat bubble and let us know how we can assist.